Prompt library
AI Prompts for Research Diagrams
Browse 59 ready-to-use prompts for methodology, ML architecture, statistical, engineering, biomedical, and educational figures.
ML Architecture
Transformer, agent, RAG, diffusion, GAN, GNN, U-Net, and MoE diagrams.
Pipeline & Workflow
Research pipelines, evaluation systems, qualification flows, and feedback loops.
Comparison & Mindmap
Decision trees, quadrant matrices, method comparisons, and conceptual maps.
Statistical Charts
Benchmark bars, ROC curves, forest plots, ablations, and error analyses.
Engineering Systems
Control systems, edge-cloud pipelines, signal chains, and safety layers.
Life Science & Medicine
Pathways, experimental panels, CRISPR, ADME, tumor evolution, and cell cycles.
Educational Infographics
Process cycles, timelines, technical explainers, maps, and orthographic views.
Image-to-Image Polish
Refine labels, colors, typography, contrast, and journal-cover visual impact.
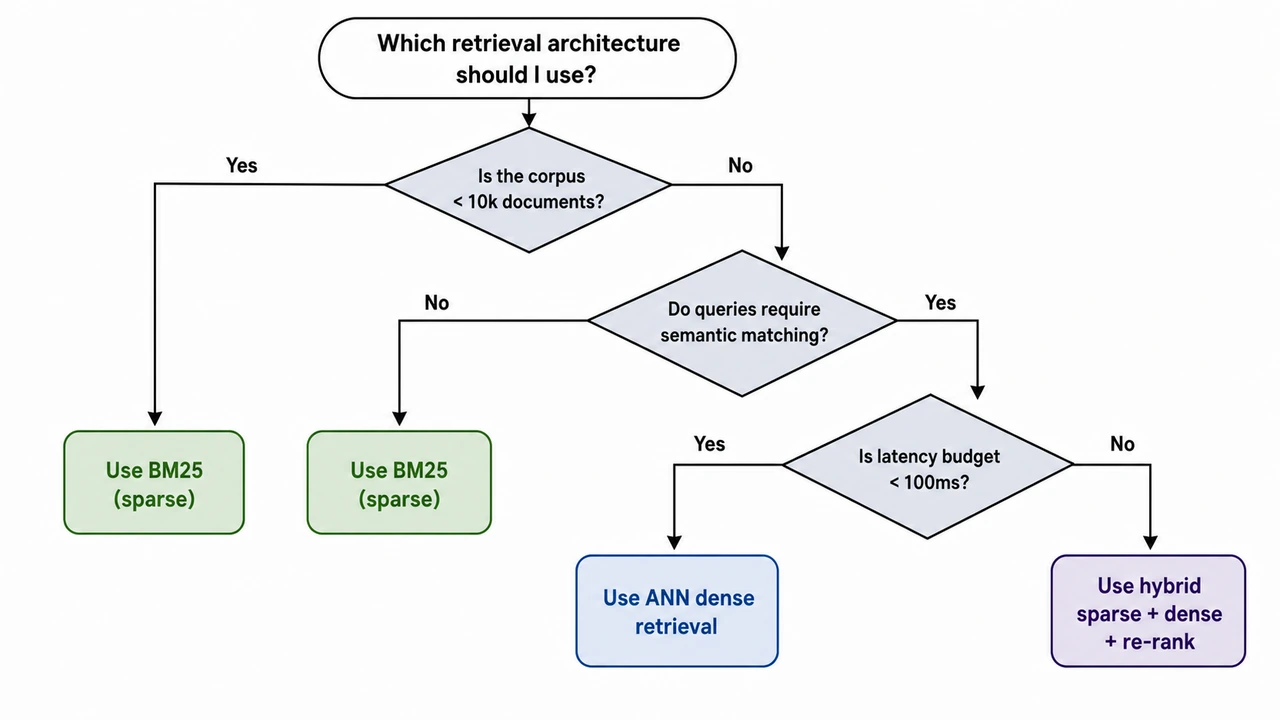
Decision-Tree Selection Workflow
Yes/No branches guiding the reader from a starting question to a recommended approach.
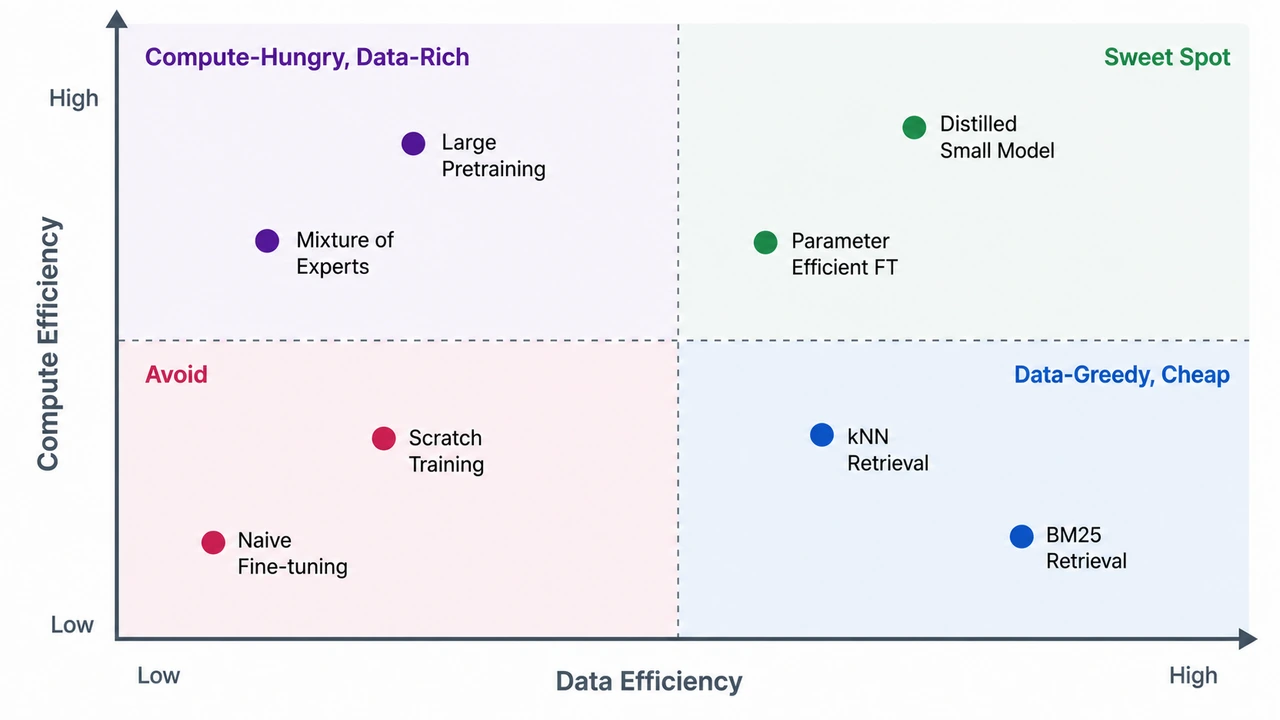
Four-Quadrant Positioning Matrix
Two-axis scatter dividing options into four labeled quadrants with example methods placed inside.
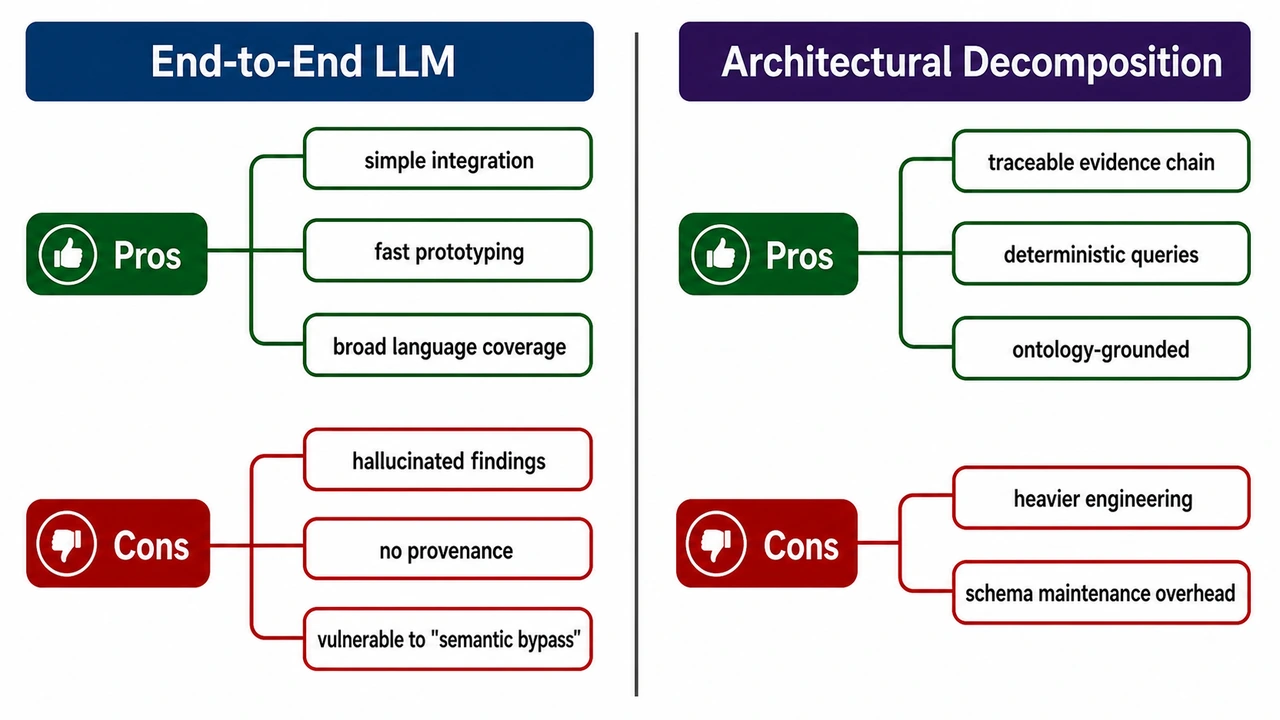
Method Comparison Mind Map (Pros vs Cons)
Clean side-by-side comparison of two approaches with color-coded pros and cons branches.
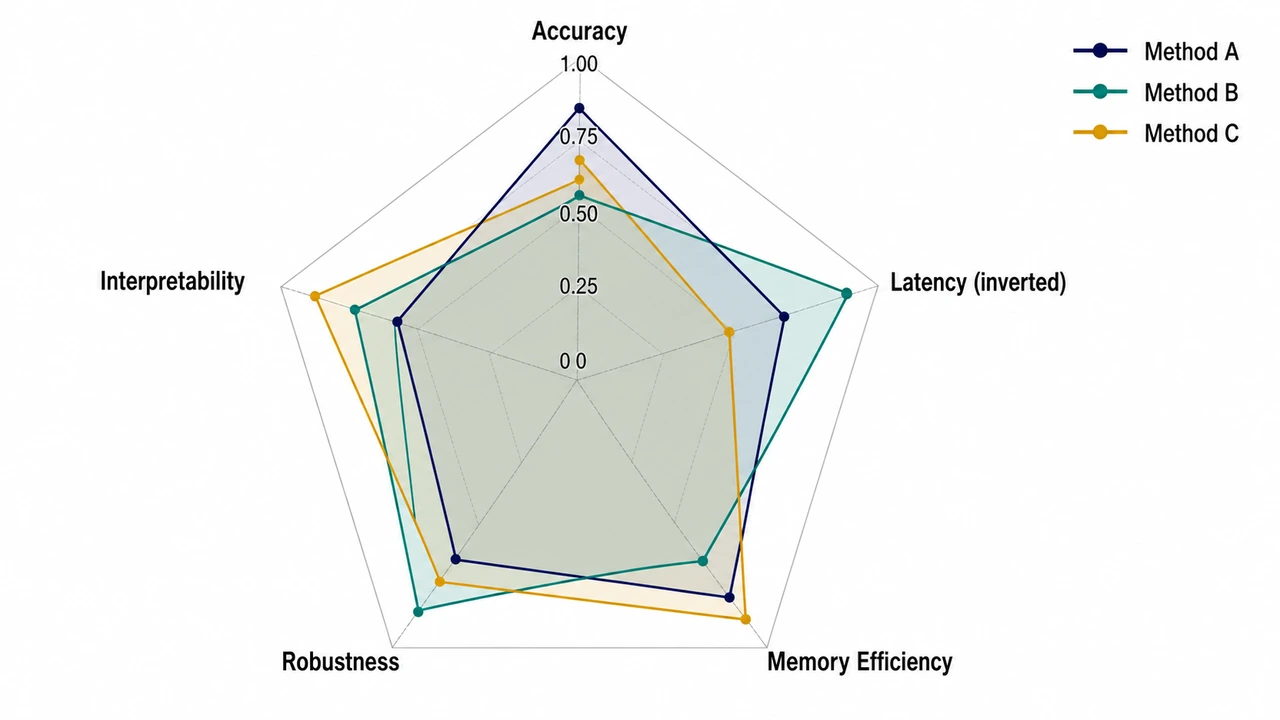
Method Comparison Radar Chart
Multi-axis radar comparing three methods on five evaluation dimensions.
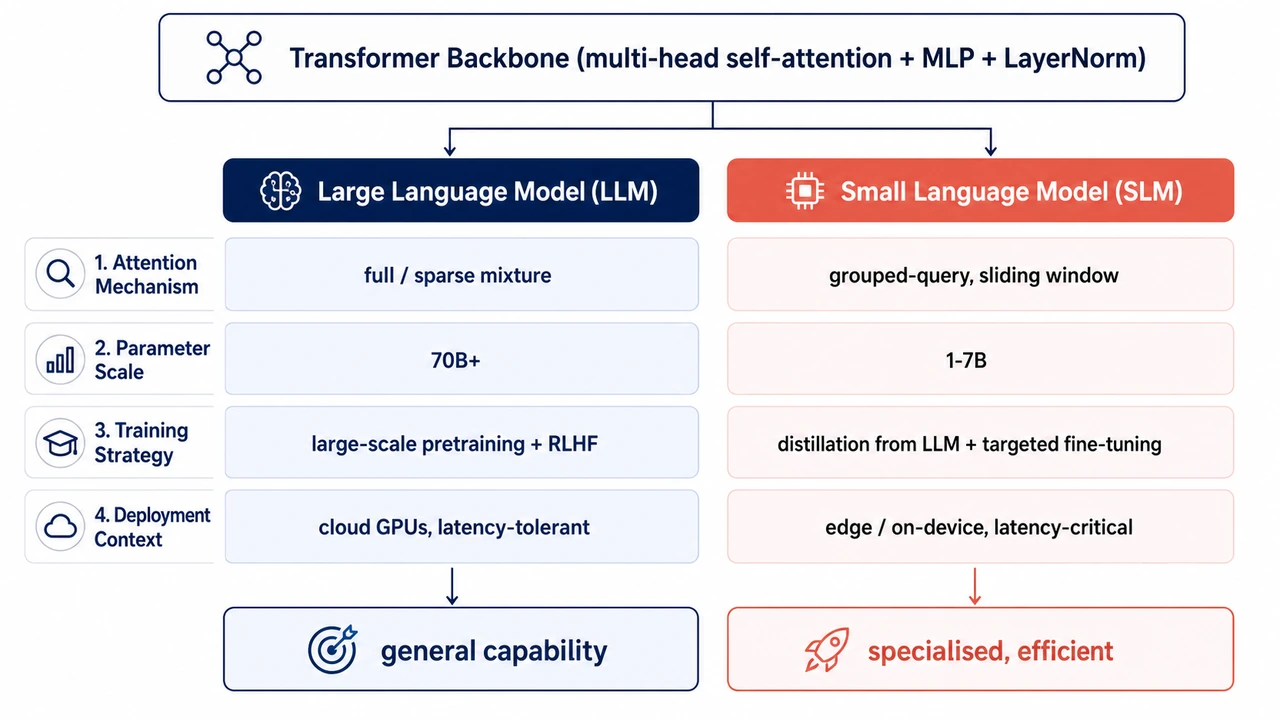
Shared-Foundation, Divergent-Choices Comparison
Two systems share a common foundation but diverge across attention, scale, training, and deployment.
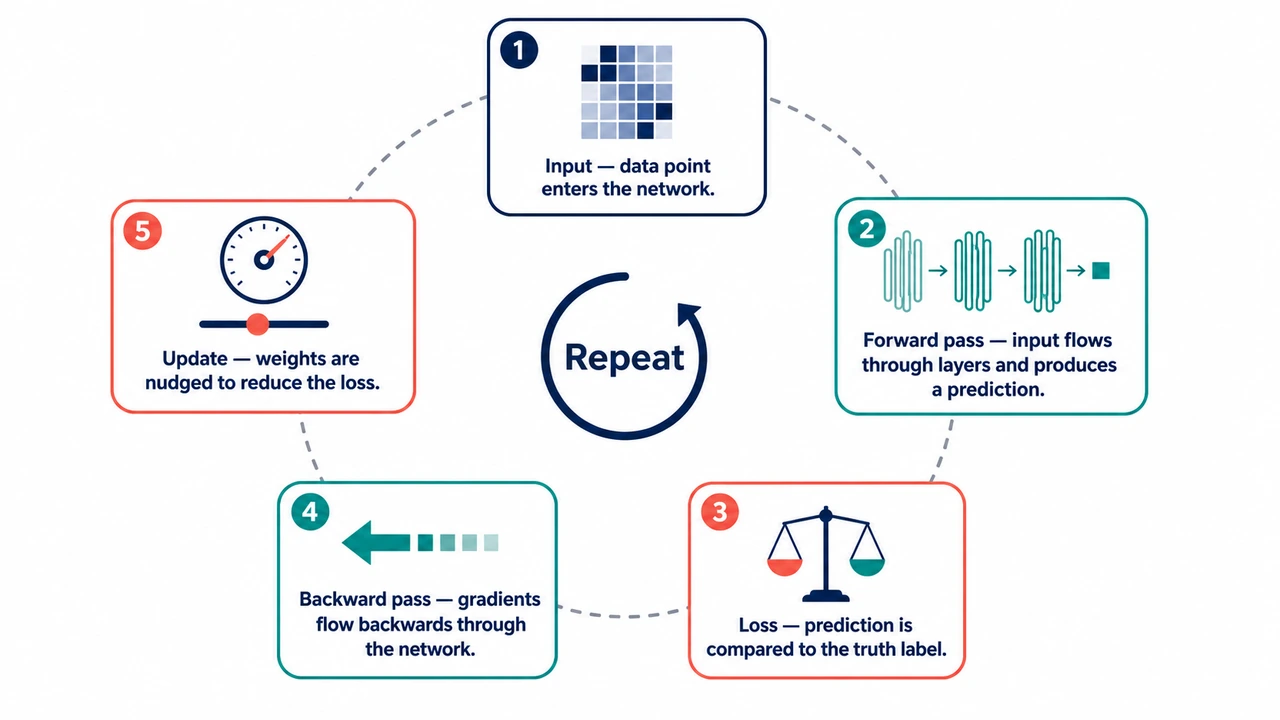
Process Cycle Infographic (Educational)
Friendly five-step educational cycle diagram with icons and concise labels.
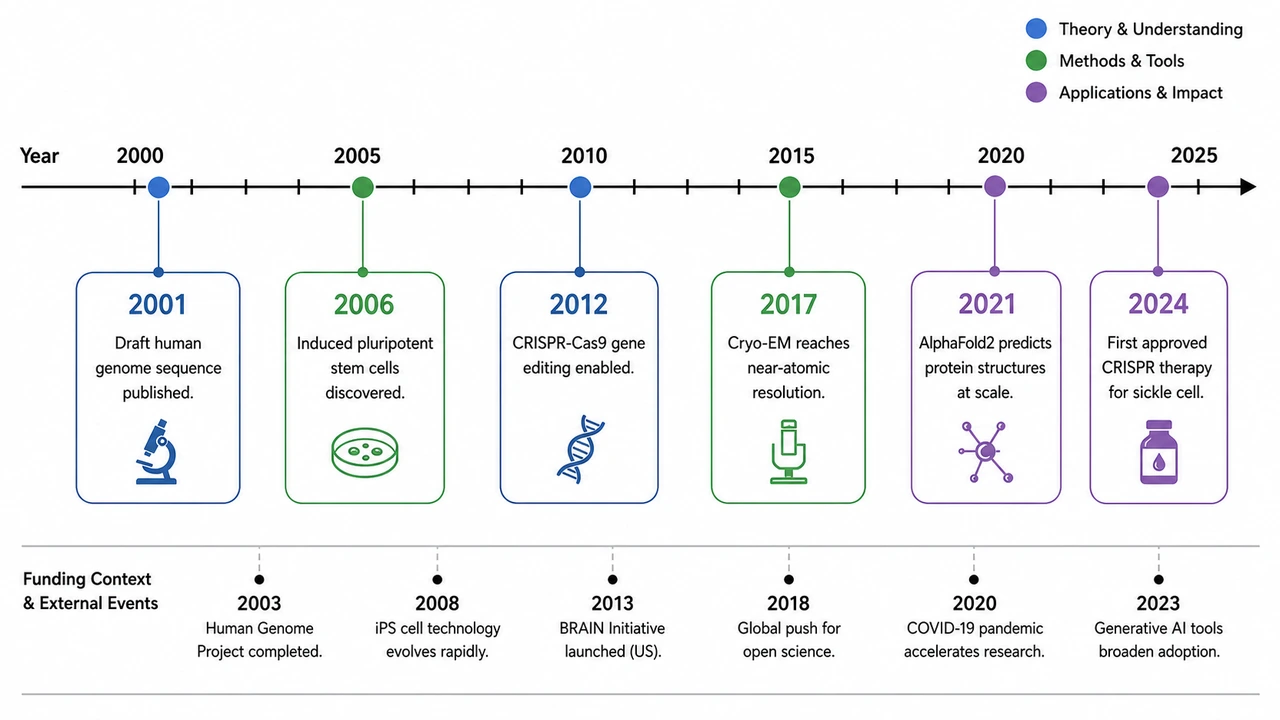
Scientific Discovery Timeline
Horizontal milestone timeline with date markers, one-line descriptions and small icons.
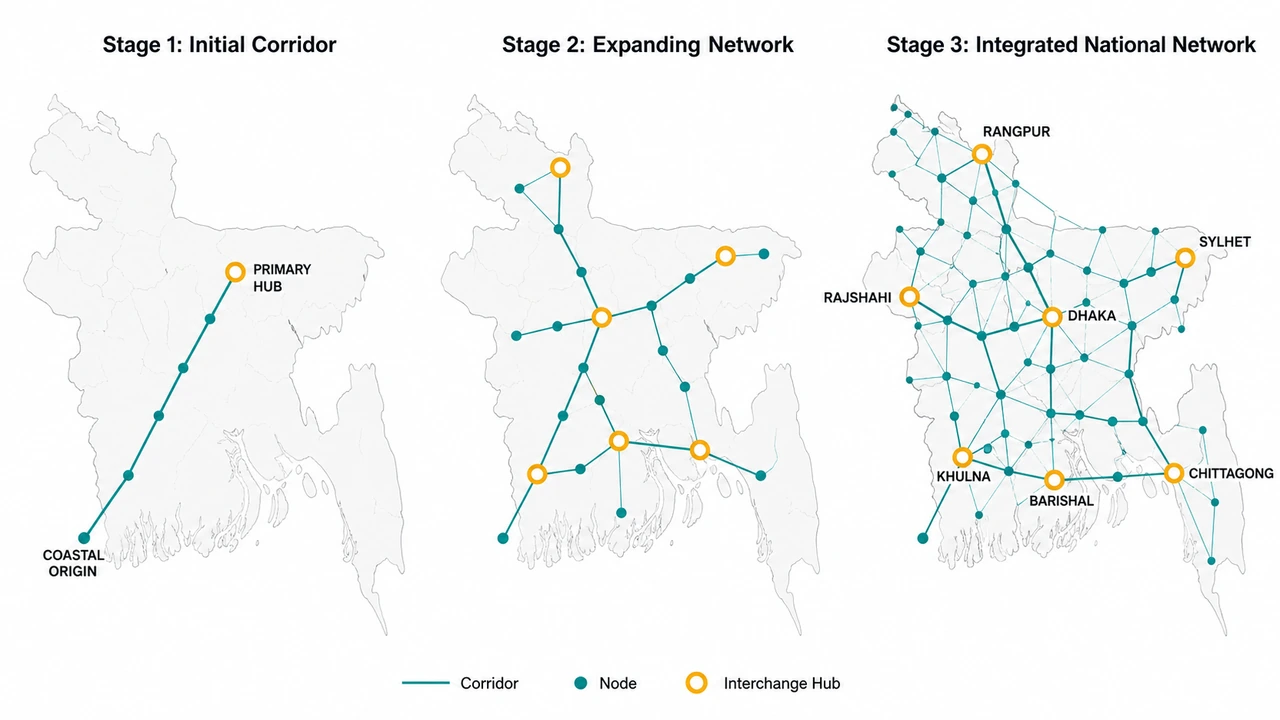
Cross-Regional Corridor / Network Map
Country outline with multi-stage build-out of a network corridor across regions.
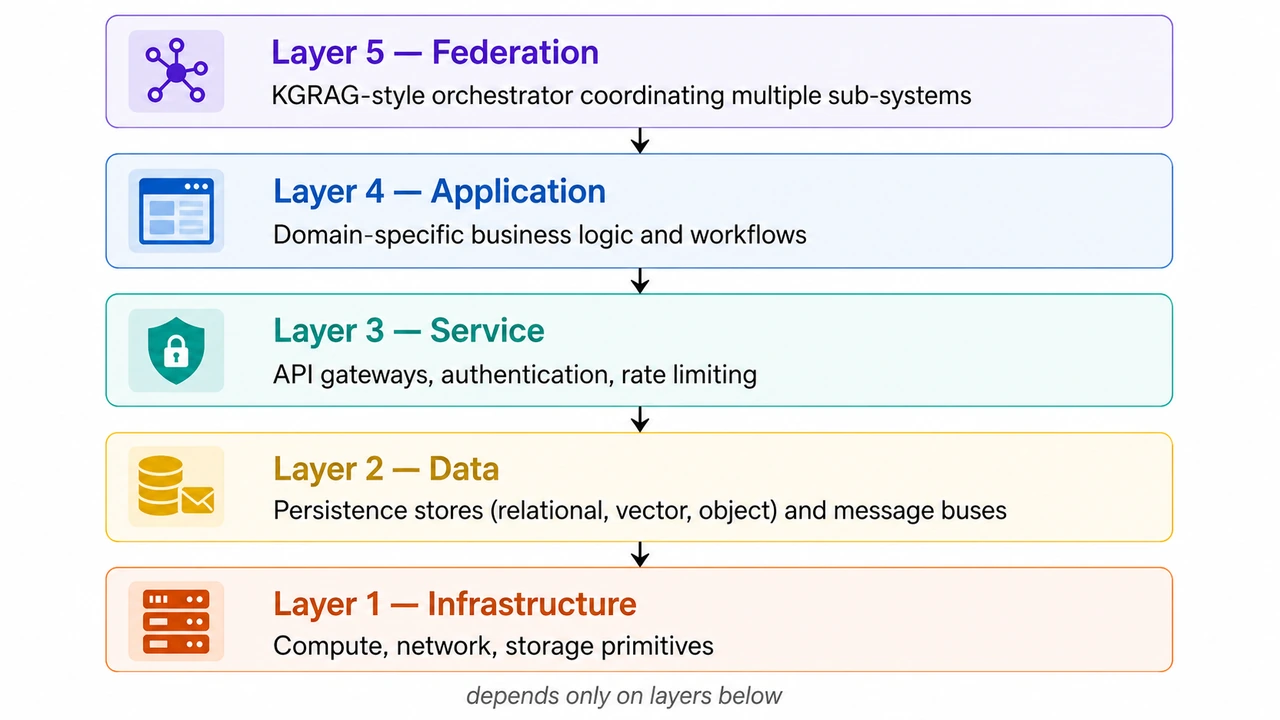
Layered System Architecture Stack
Five-layer abstraction stack with single responsibility per layer and downward dependencies only.
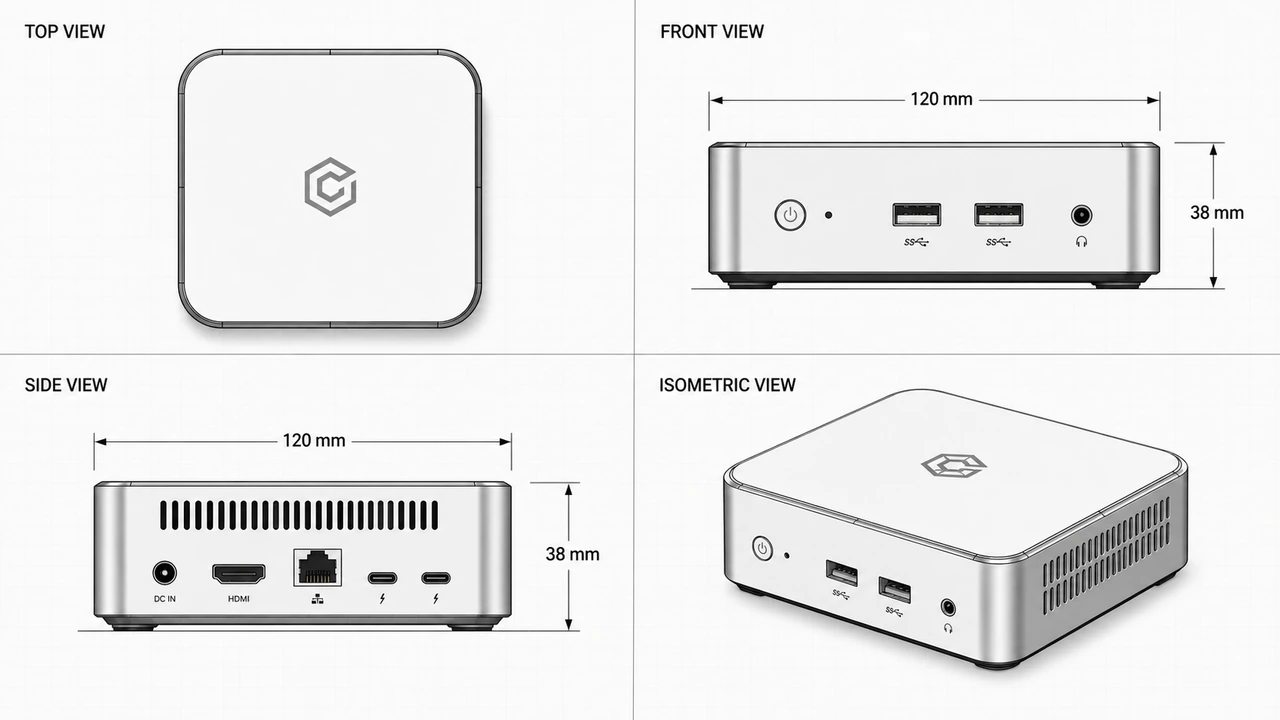
Multi-View Orthographic Product Illustration
Top, front, side, and isometric views of a product on a clean grid for spec sheets.
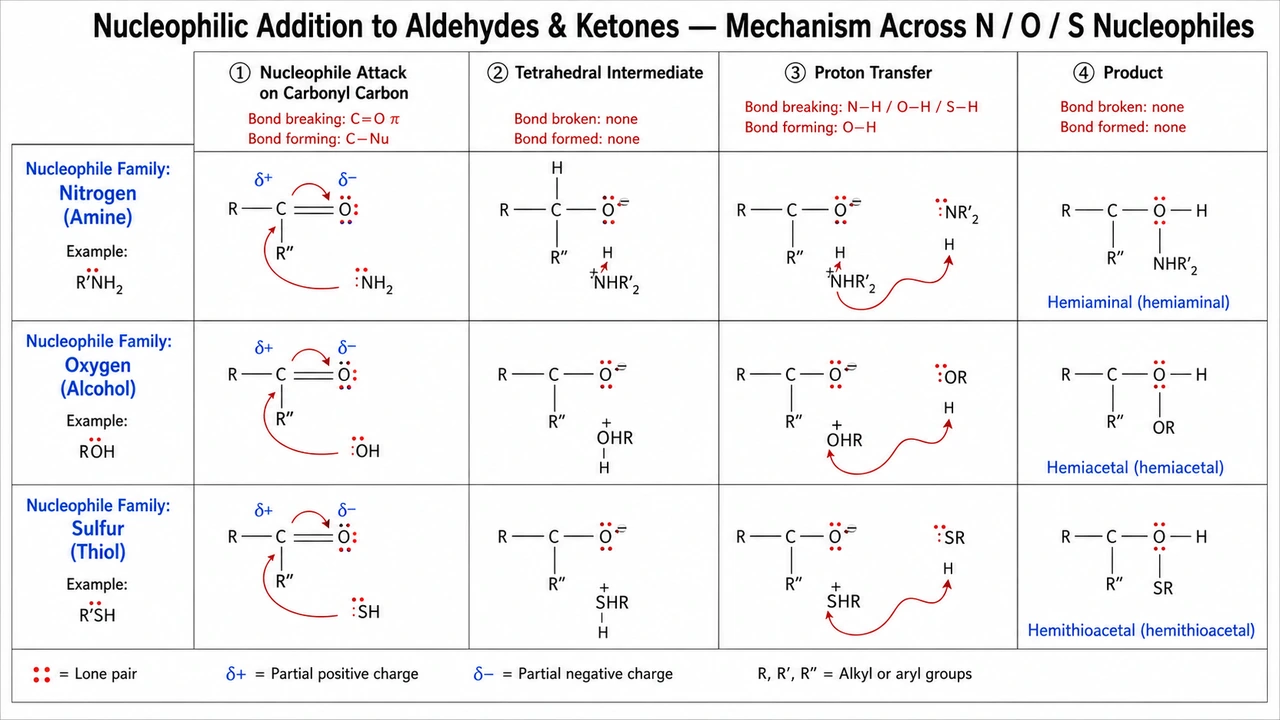
Organic Reaction Mechanism Explainer
Curly-arrow mechanism showing nucleophilic addition step by step with side-by-side analogues.
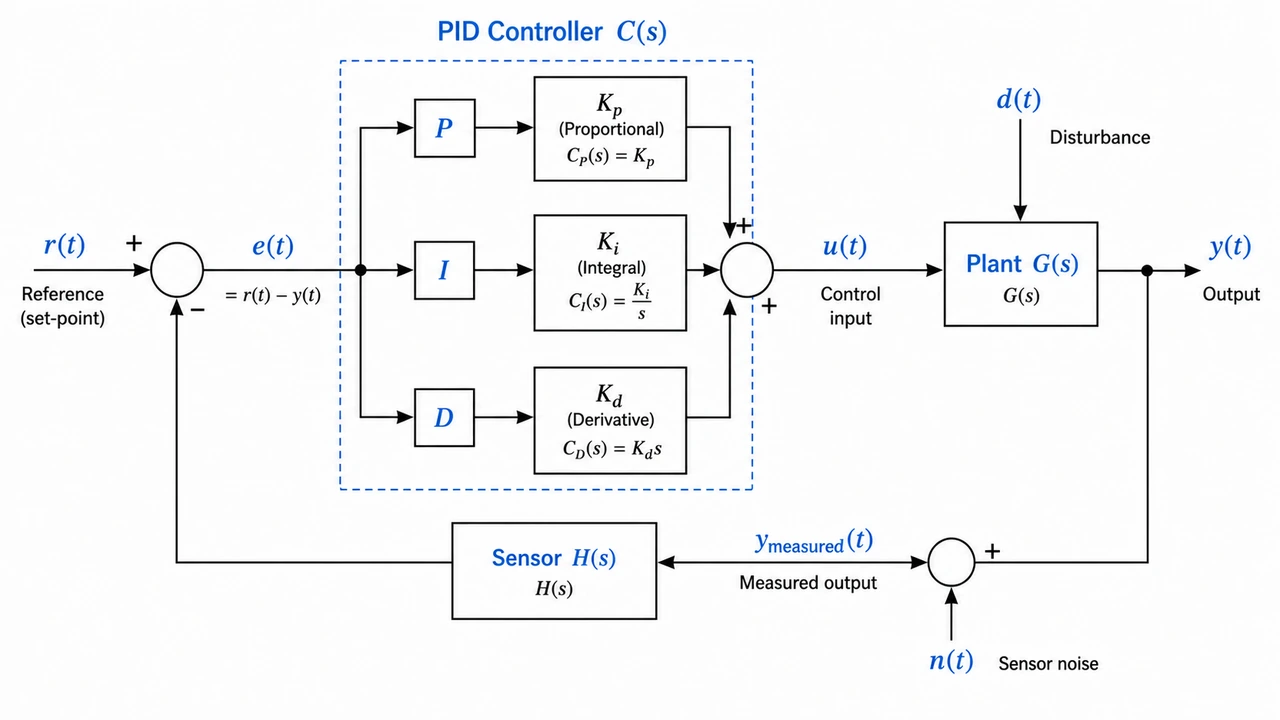
PID Control Loop
Classic feedback control loop with set-point, error, controller, plant, sensor and disturbance.
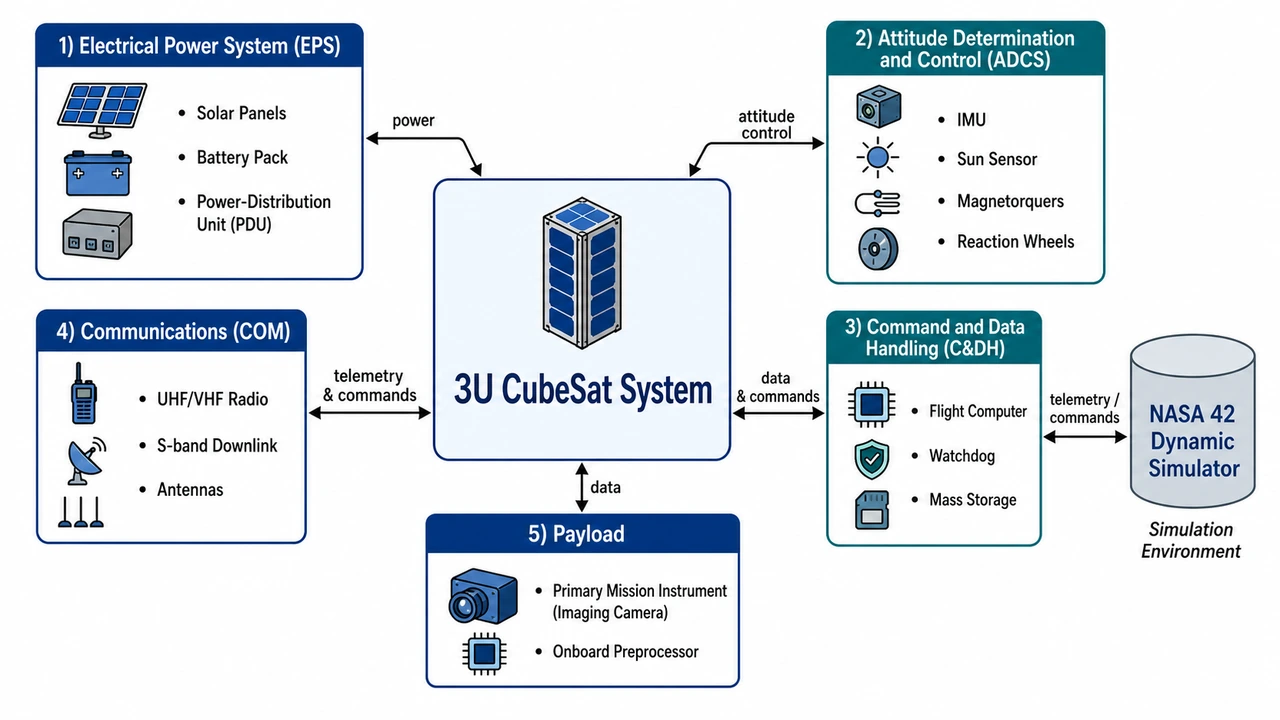
3U CubeSat System Architecture
Block diagram of CubeSat subsystems with simulation environment integration.
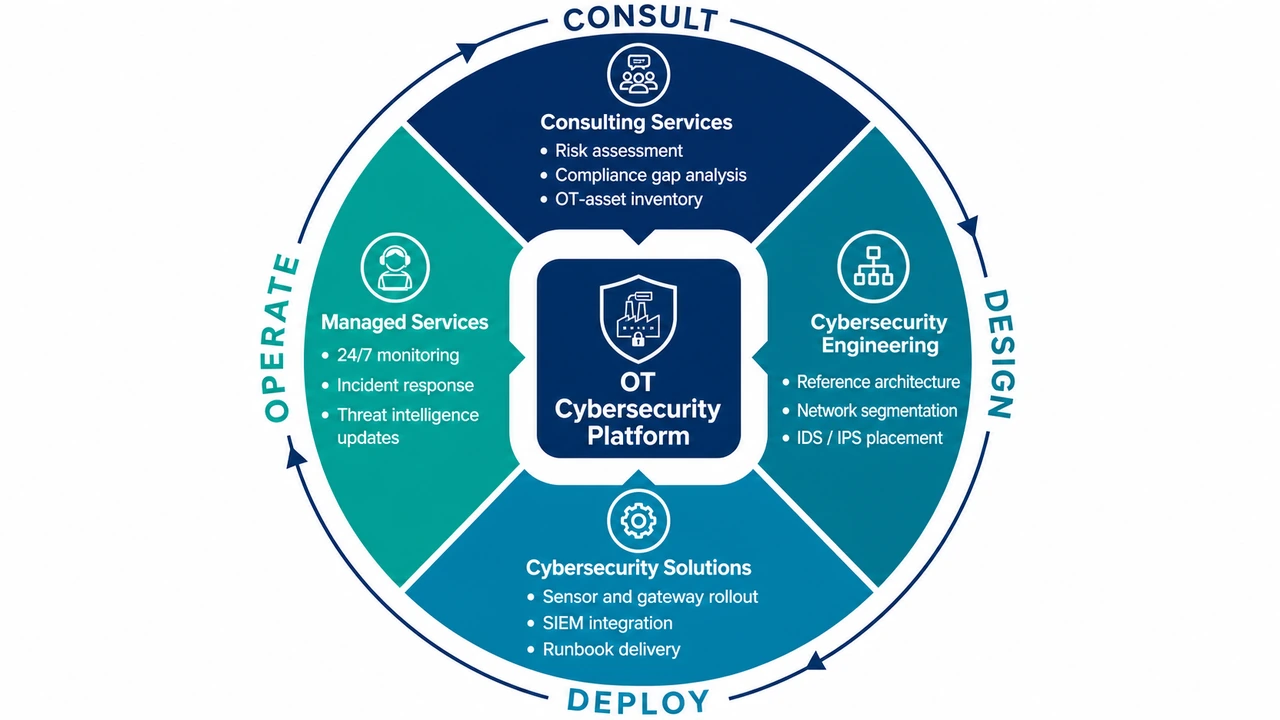
OT Cybersecurity Service Lifecycle
A circular four-phase service lifecycle around an OT cybersecurity platform.
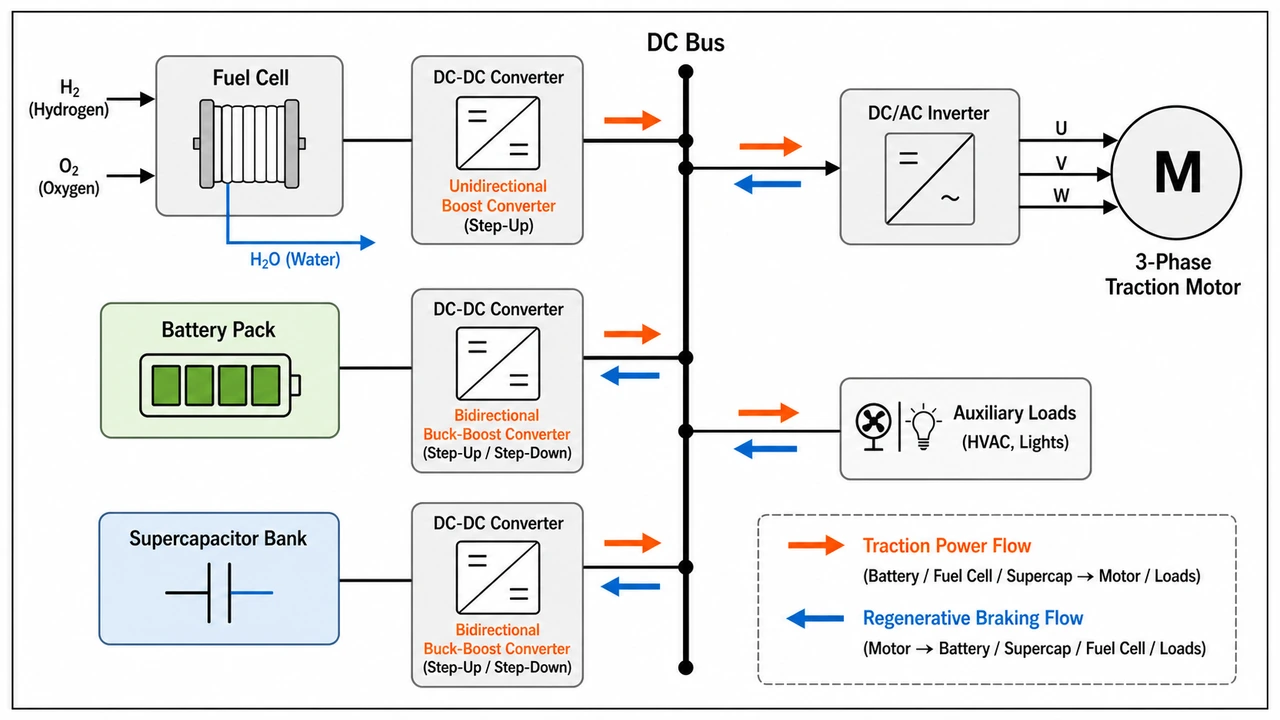
Hybrid Energy Storage System Schematic
EV power-architecture diagram with fuel cell, battery, and supercapacitor through DC-DC converters.
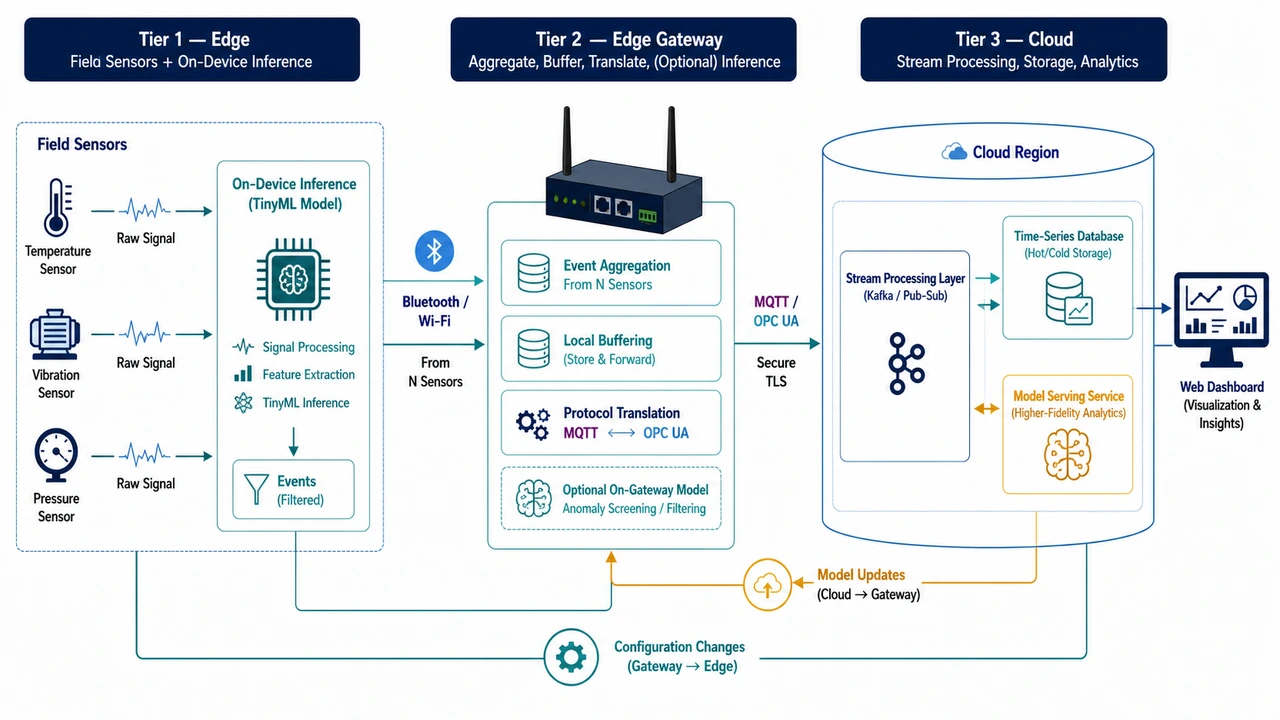
IoT Sensor → Edge → Cloud Pipeline
Three-tier IoT data path with sensors at the edge, gateway aggregation, and cloud analytics.
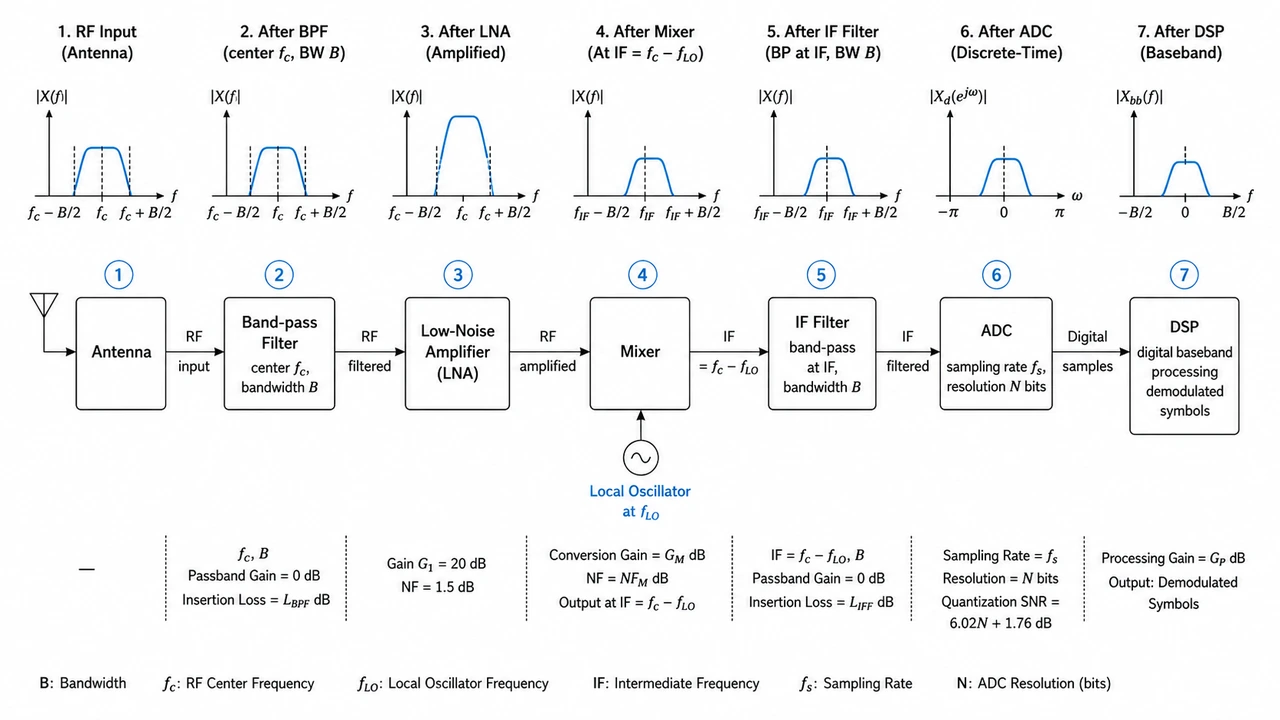
RF Receiver Signal Chain
Antenna → LNA → mixer → IF filter → ADC → DSP, with annotated gains and frequencies.
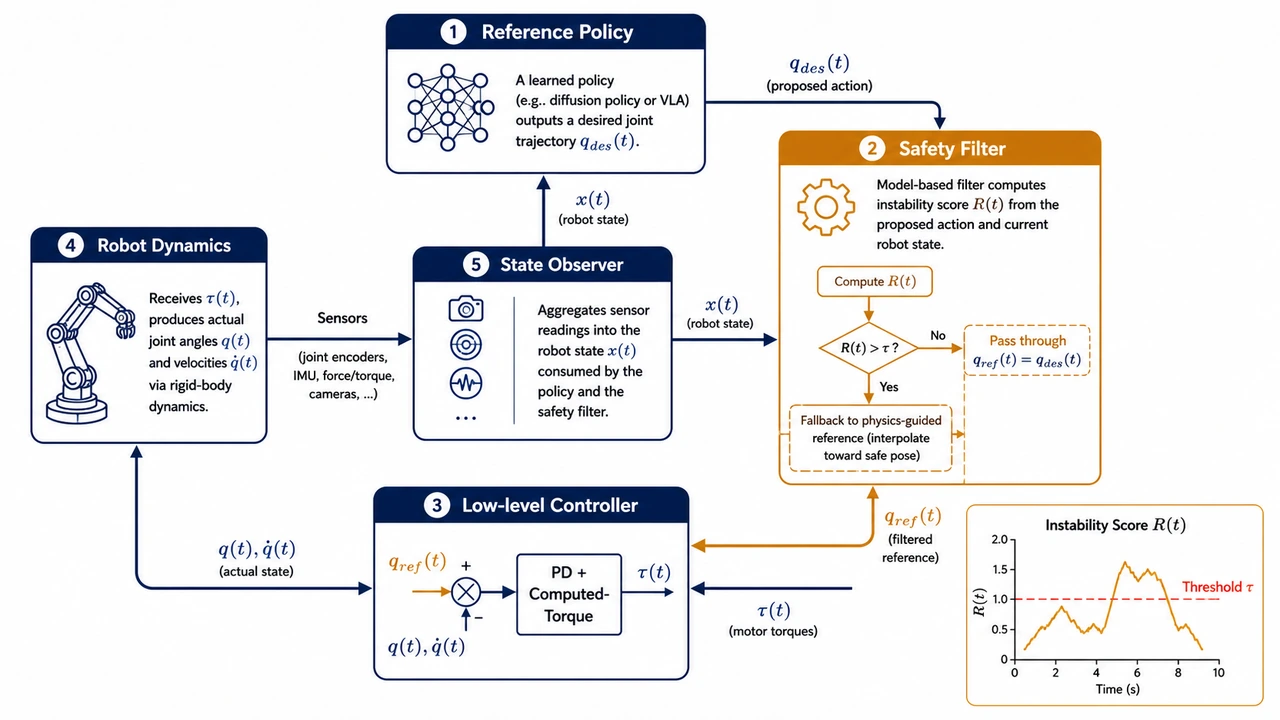
Robotics Motion-Control Loop with Safety Layer
Reference policy + low-level controller + robot dynamics + safety filter, with stability indicator.
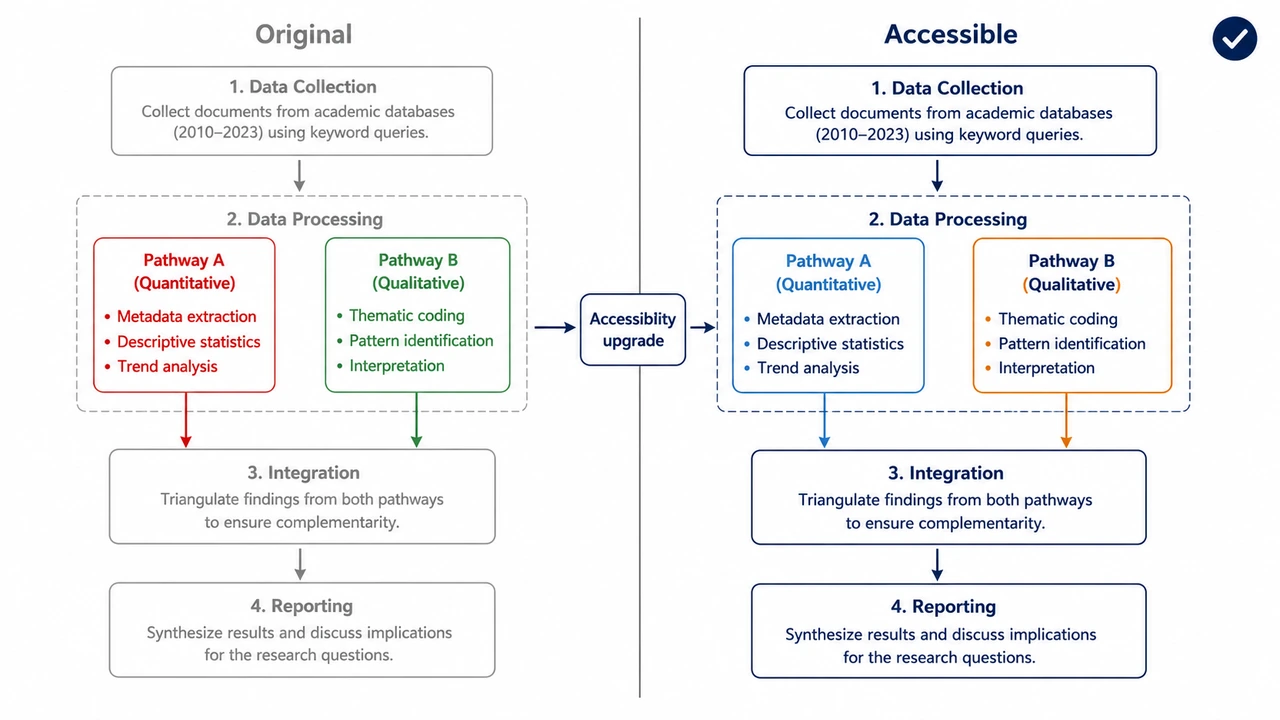
Accessibility / Color-Contrast Upgrade
Improve color contrast, increase font sizes and add color-blind-safe palette without changing content.
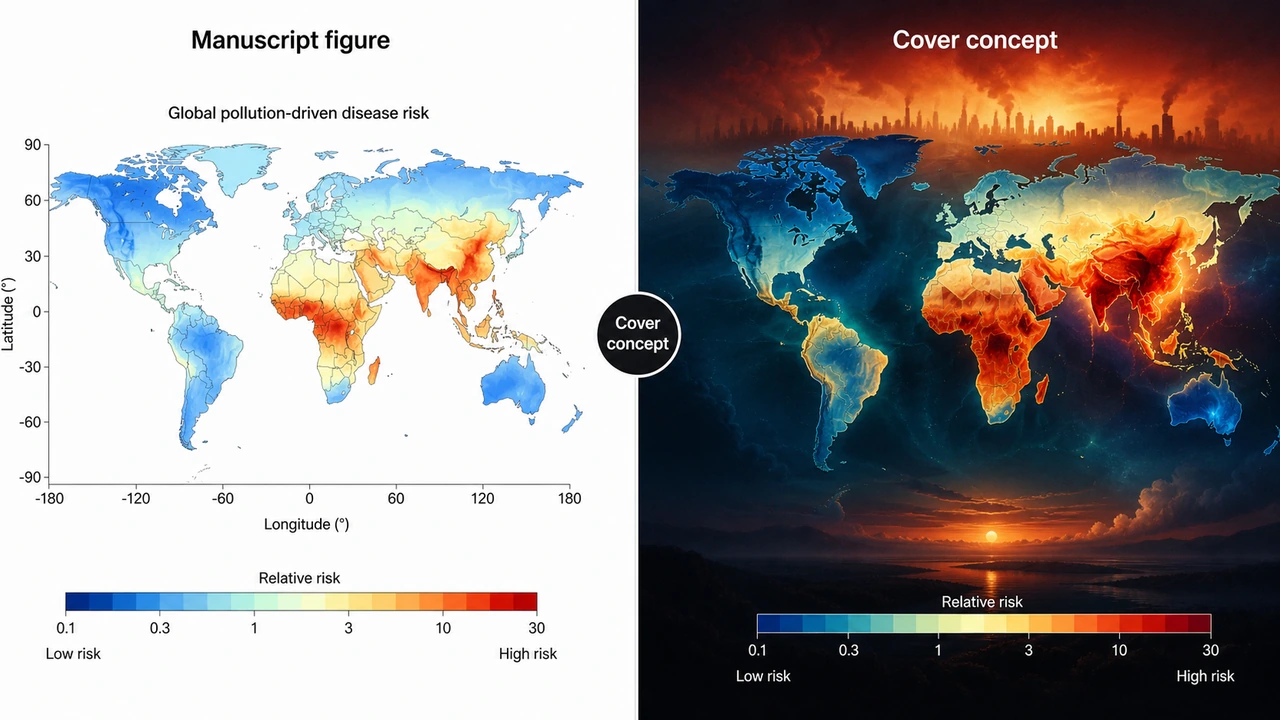
Upgrade to Journal-Cover Impact Style
Polish a scientific figure into a Science / Nature cover-style hero visual while keeping the data structure intact.
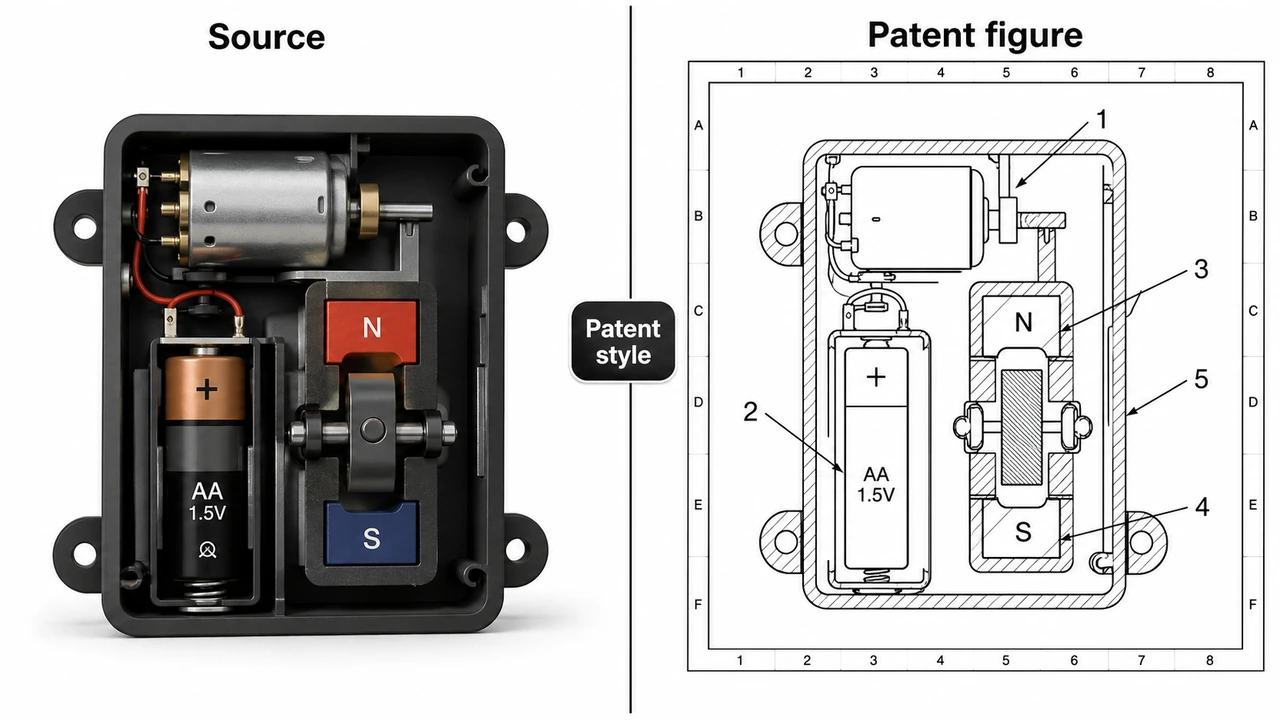
Patent / Technical Drawing Conversion
Convert a colored product render to clean monochrome line art with reference-numbered callouts.
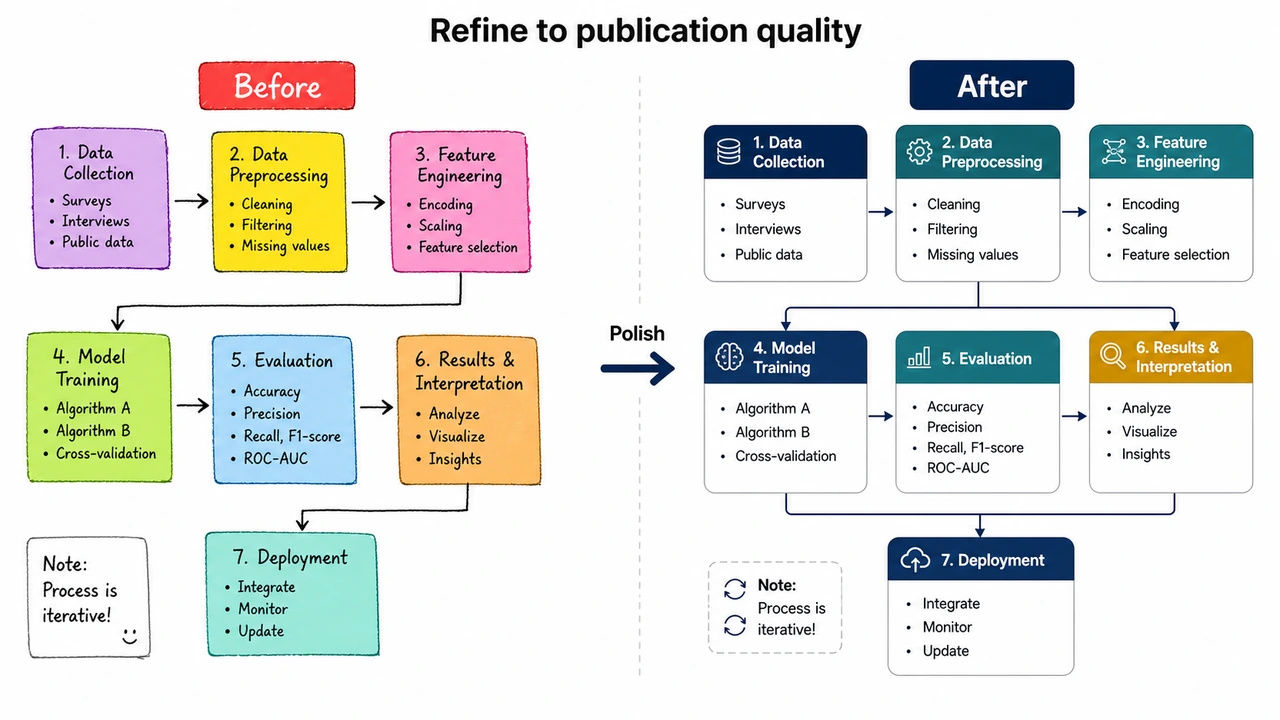
Refine Color & Typography (Image-to-Image)
Polish an existing diagram into publication quality without redesigning it.
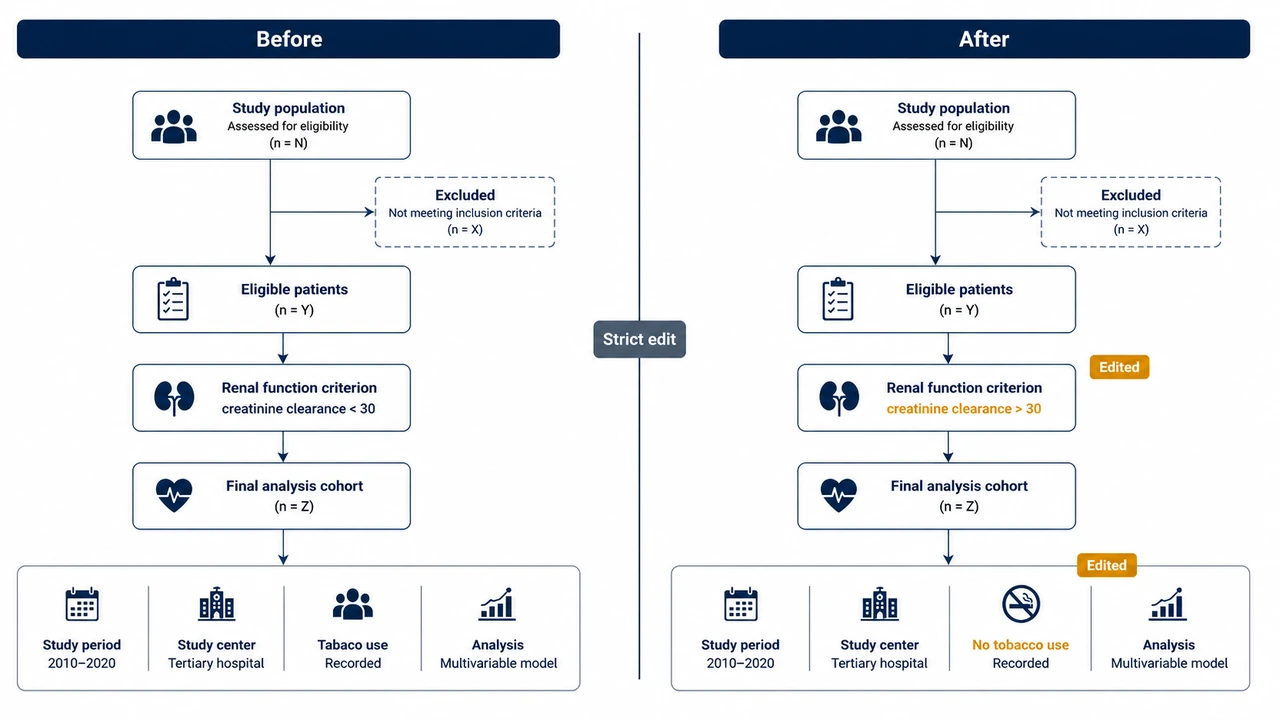
Strict Label Rename / Value Edit
Surgical text edits to an existing diagram while preserving every other element.
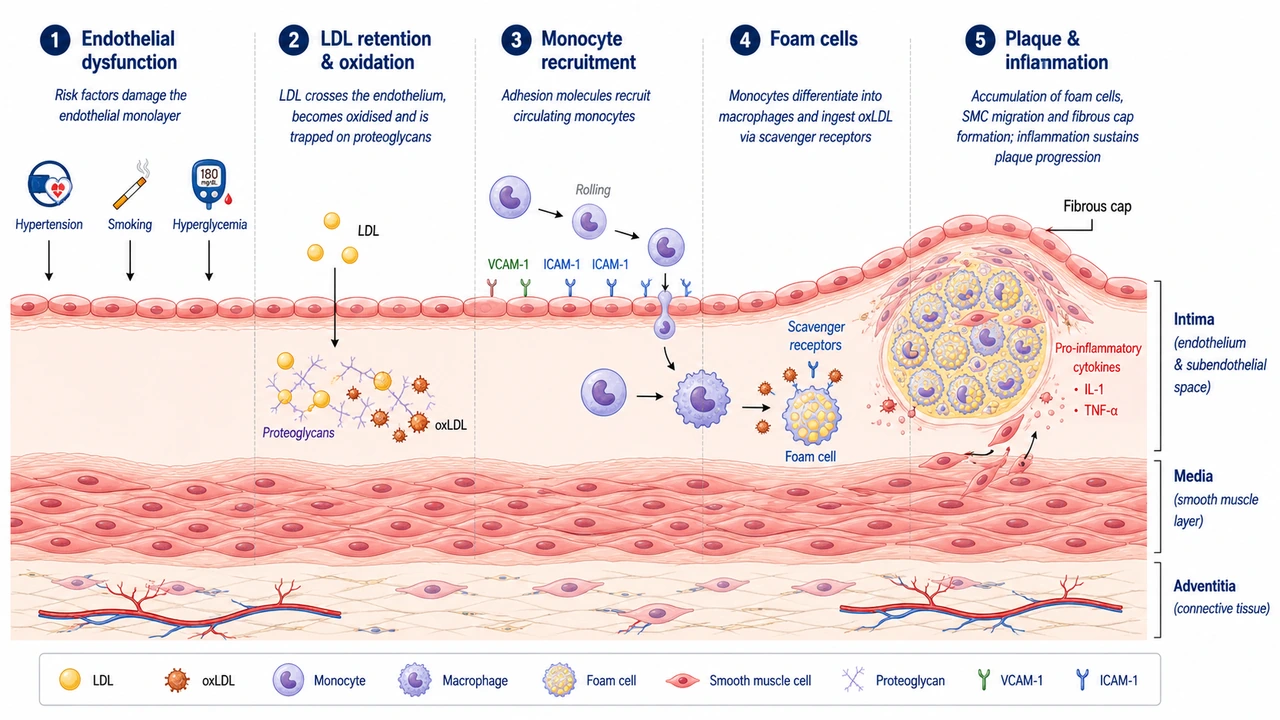
Atherosclerosis Inflammation Mechanism
Endothelial dysfunction, LDL retention, monocyte recruitment, foam cells and plaque formation.
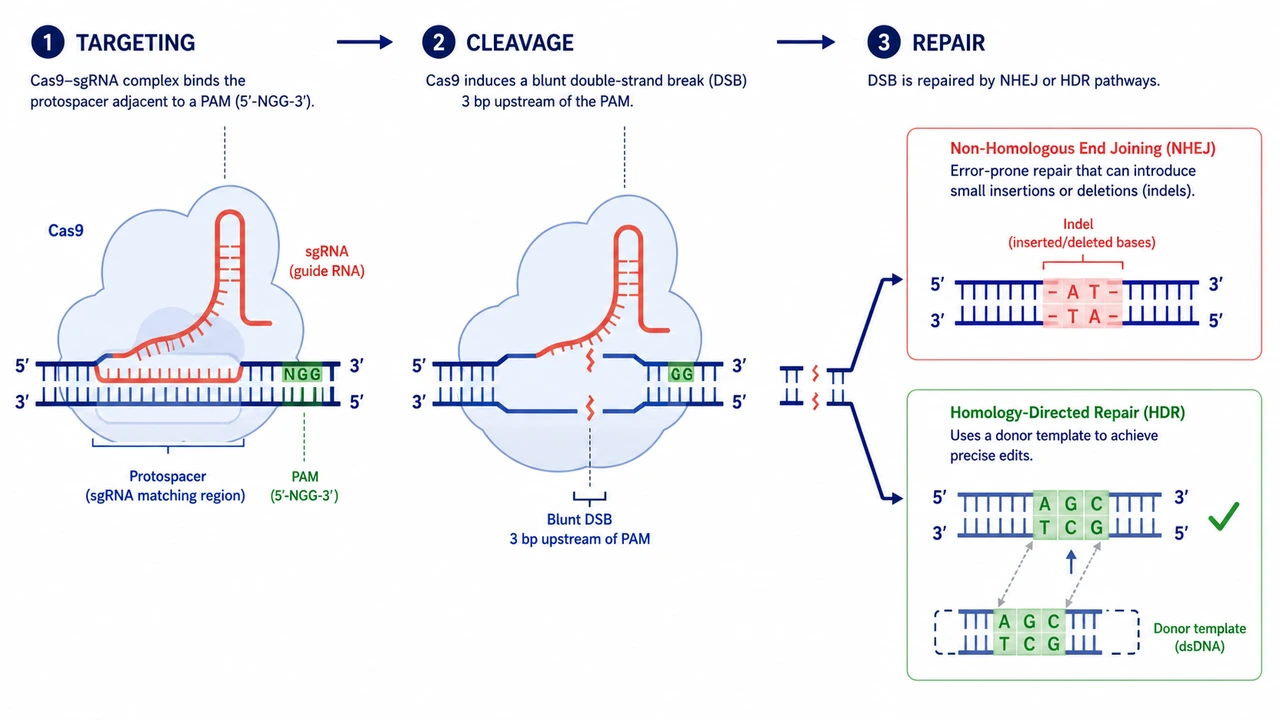
CRISPR-Cas9 Mechanism Diagram
Guide-RNA-loaded Cas9 binds protospacer, makes a double-strand break, and triggers NHEJ or HDR repair.
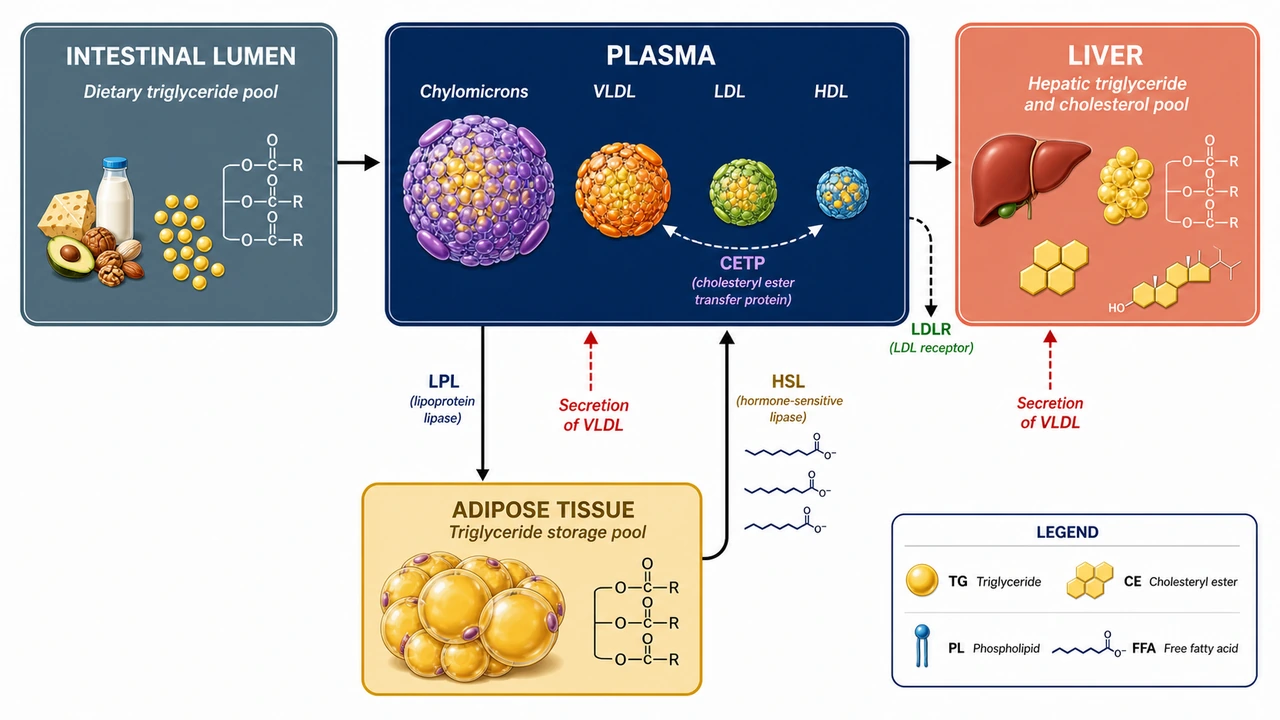
Lipid Metabolism Compartmental Diagram
Compartment-specific lipid pools with labeled flux arrows and simplified molecular icons.
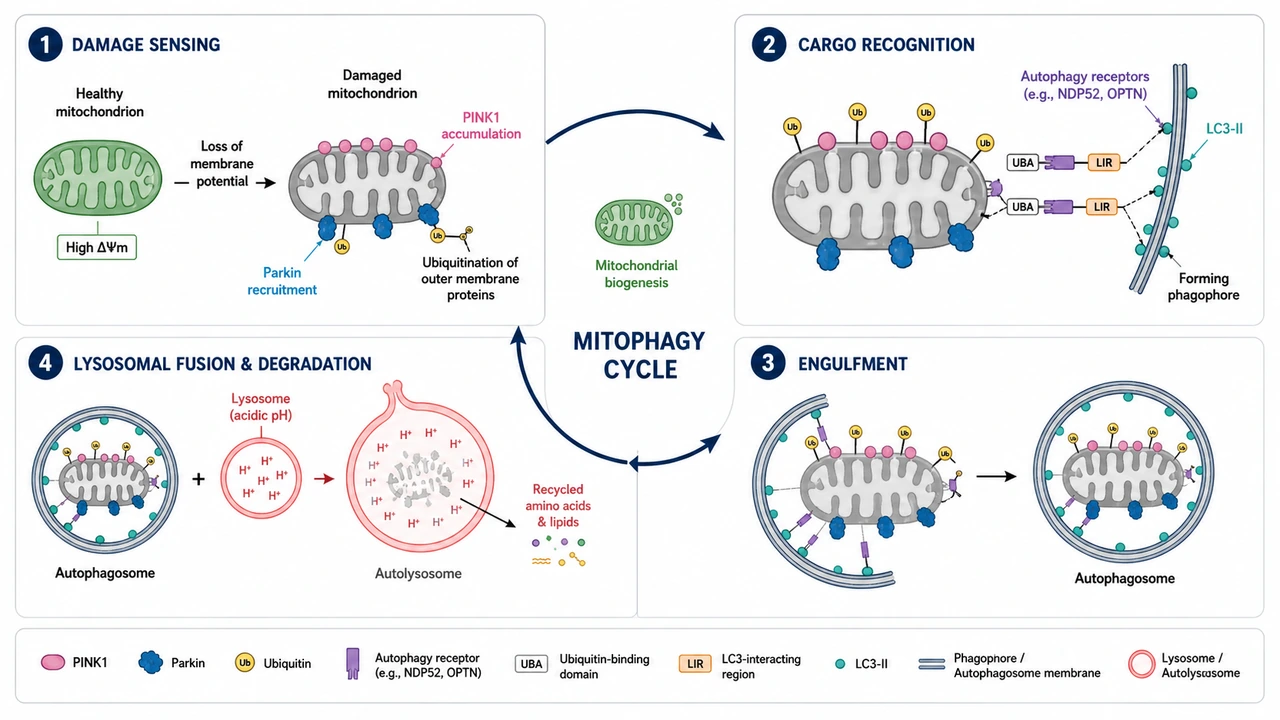
Mitophagy Cycle Diagram
PINK1/Parkin labeling, autophagosome engulfment, lysosome fusion and degradation.
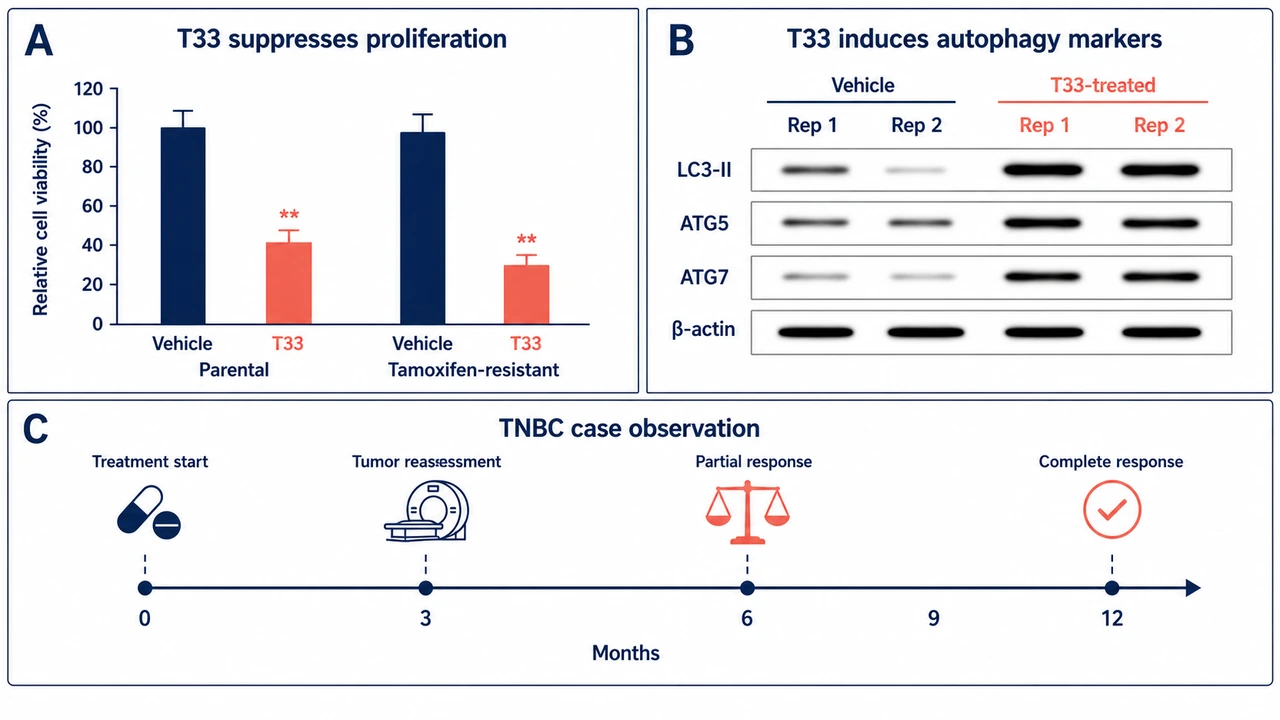
Multi-Panel Experimental Figure (A / B / C)
Three-panel composite with cell-viability, Western blot, and clinical timeline.
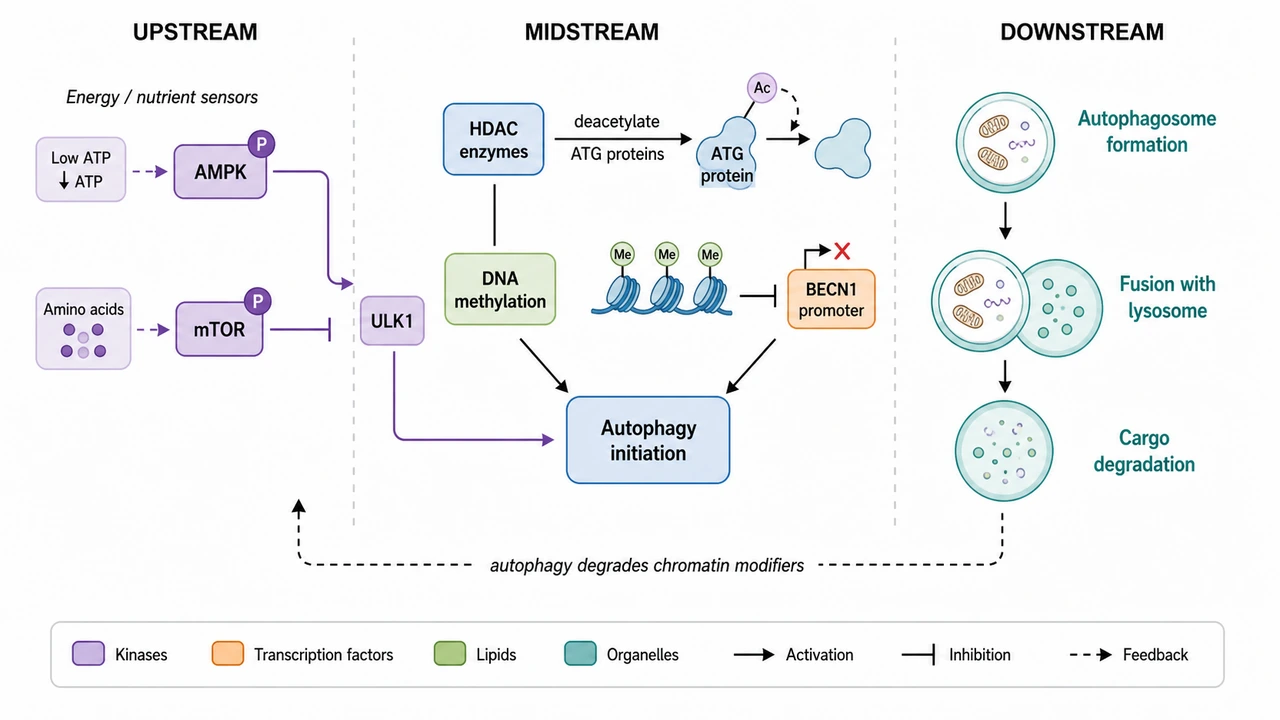
Mechanism Pathway Diagram
Cell-signaling pathway with activation and inhibition, color-coded by molecule class.
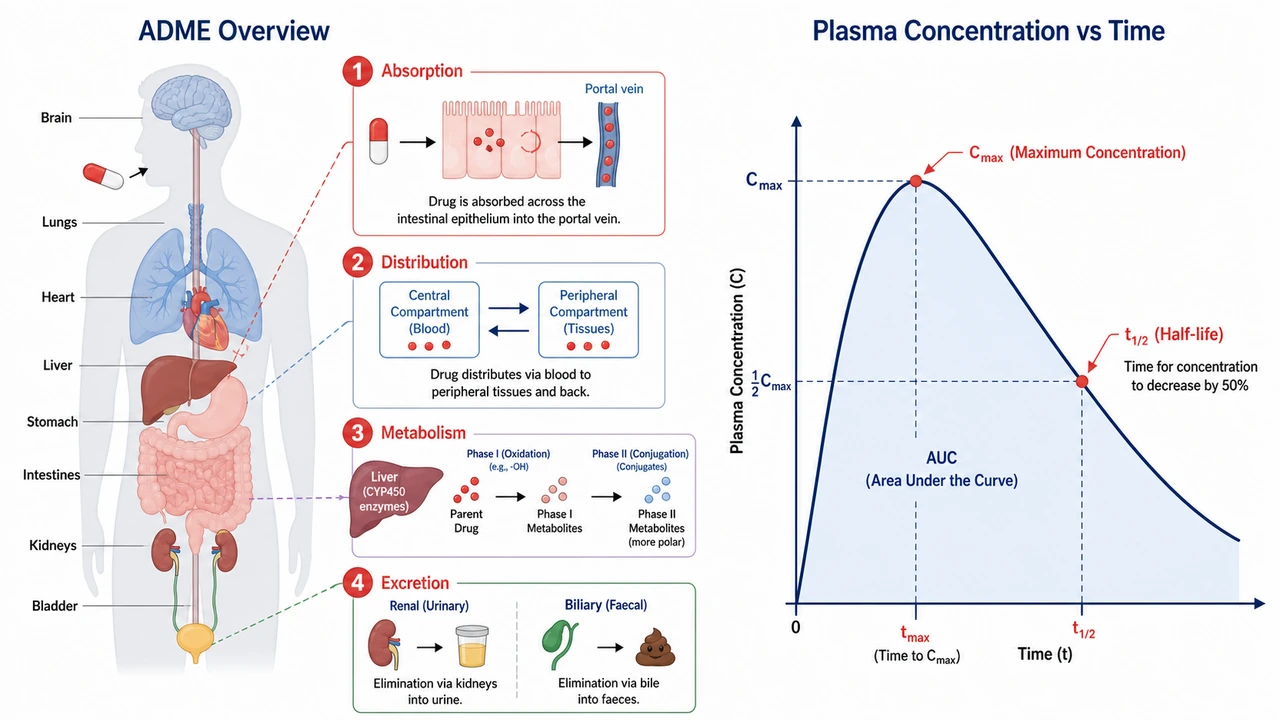
Drug Pharmacokinetics — ADME Diagram
Absorption, Distribution, Metabolism and Excretion summarised with a body schematic and a plasma curve.
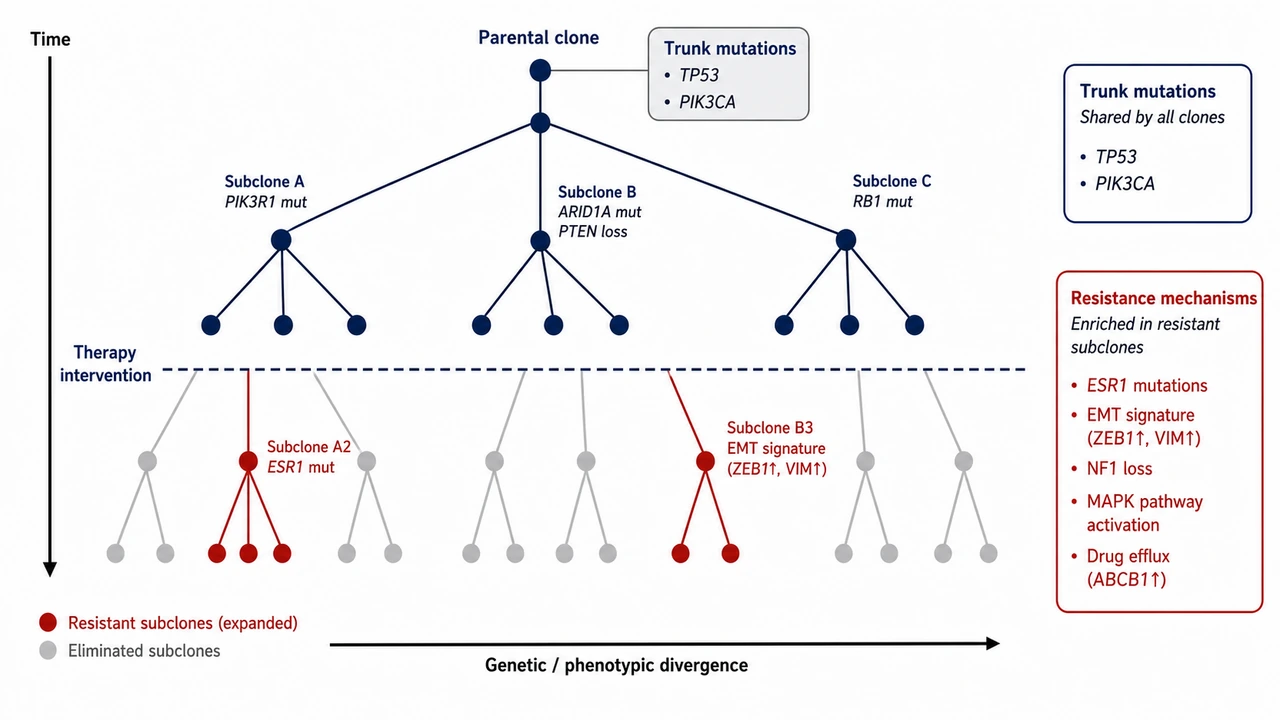
Tumor Evolutionary Tree (Subclonal Architecture)
Branched phylogeny showing parental clone diversifying into subclones under therapeutic pressure.
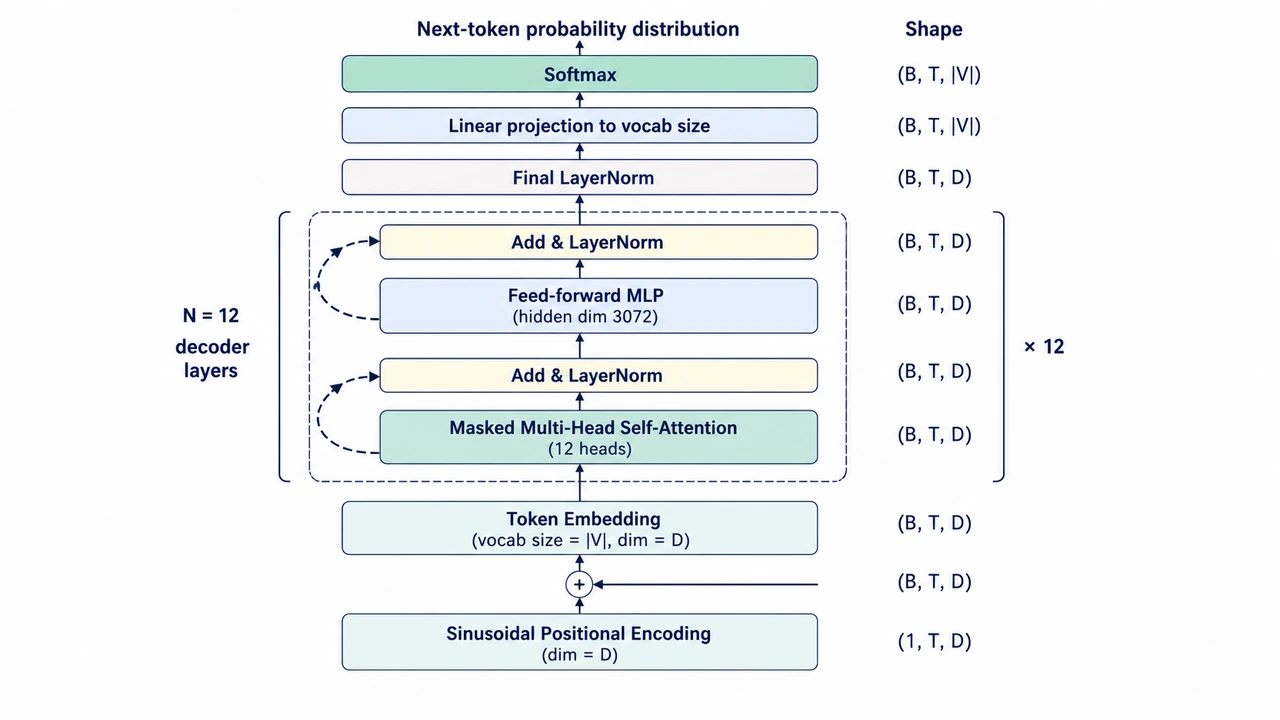
Decoder-Only LLM Architecture (GPT-Style)
Stacked decoder blocks with masked self-attention and a language modeling head.
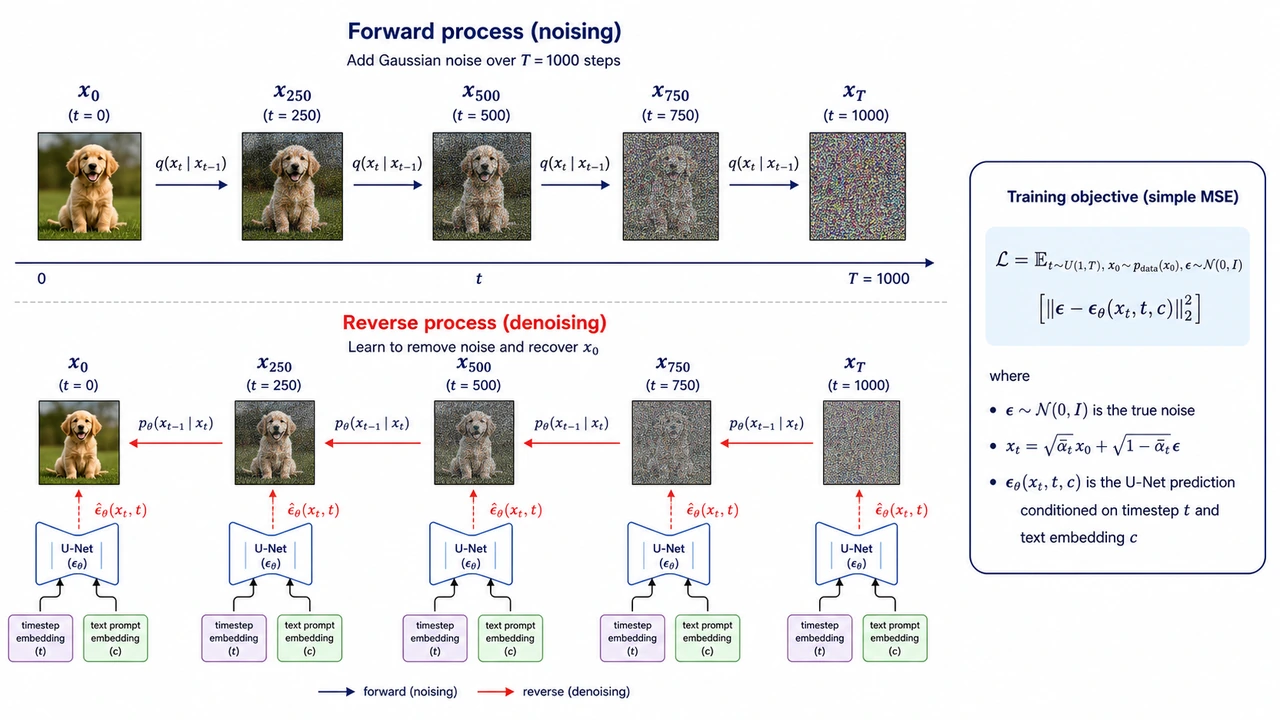
Diffusion Model Forward & Reverse Process
Forward noising chain and reverse denoising chain with a U-Net at each step.
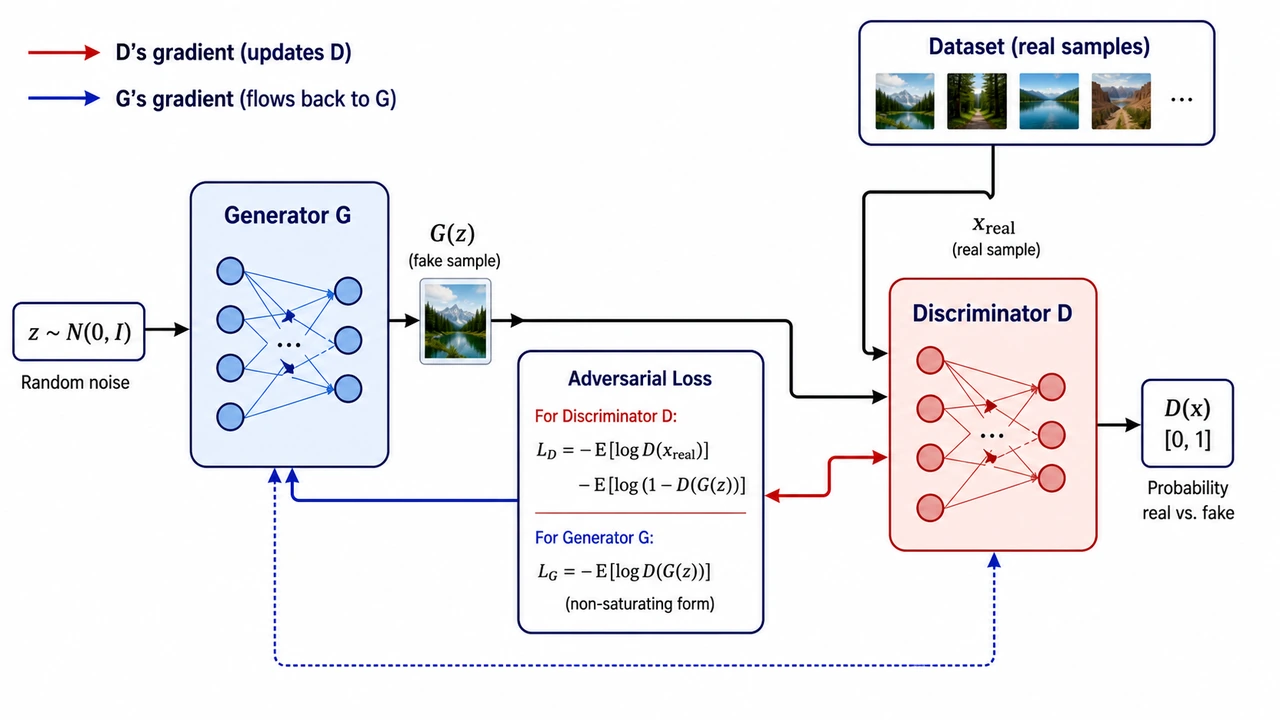
GAN Training Loop
Generator vs Discriminator adversarial loop with labeled losses and gradient flow.
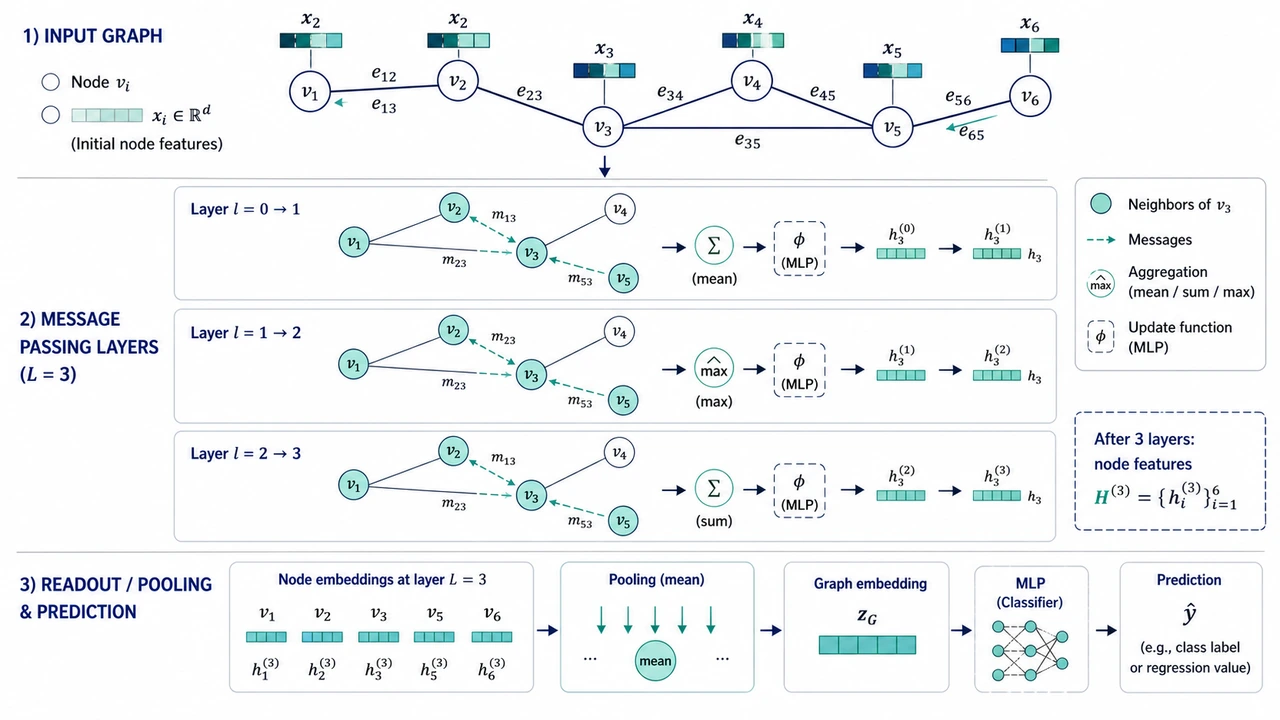
Graph Neural Network Message Passing
Node feature update via neighborhood aggregation across L message-passing layers.
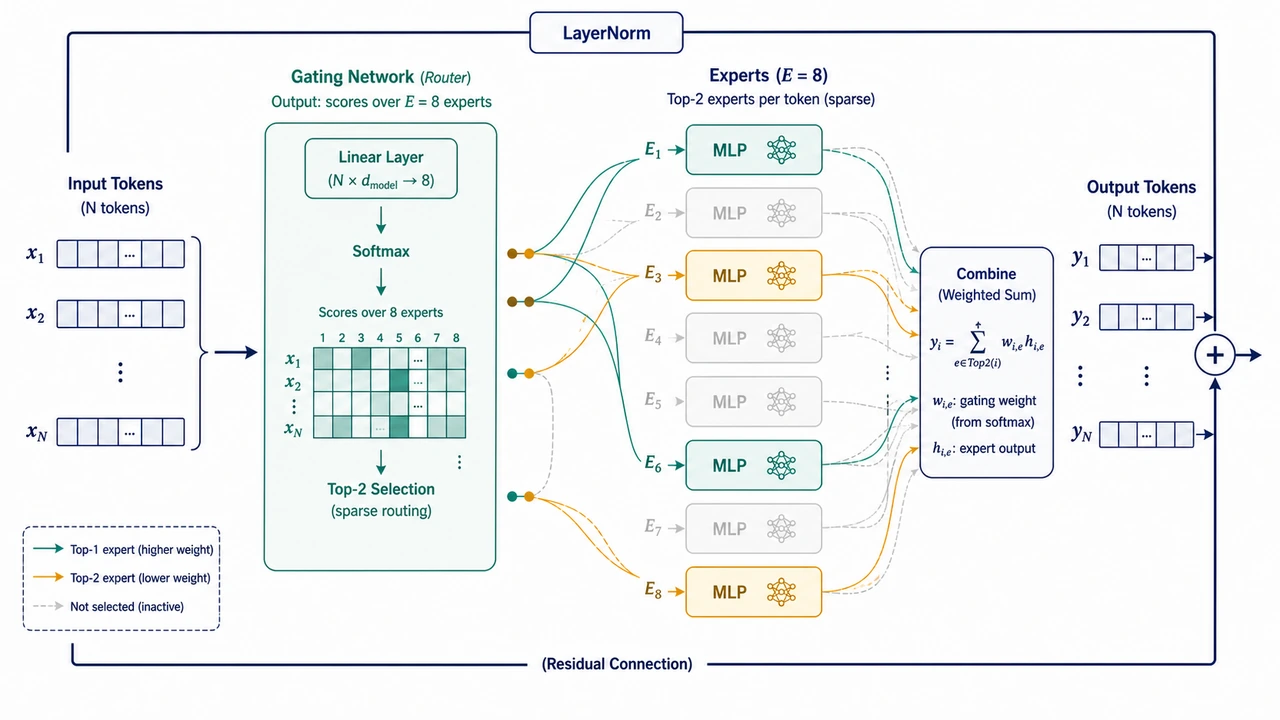
Mixture-of-Experts (MoE) Layer
Sparse routing of tokens through a gating network into top-k experts.
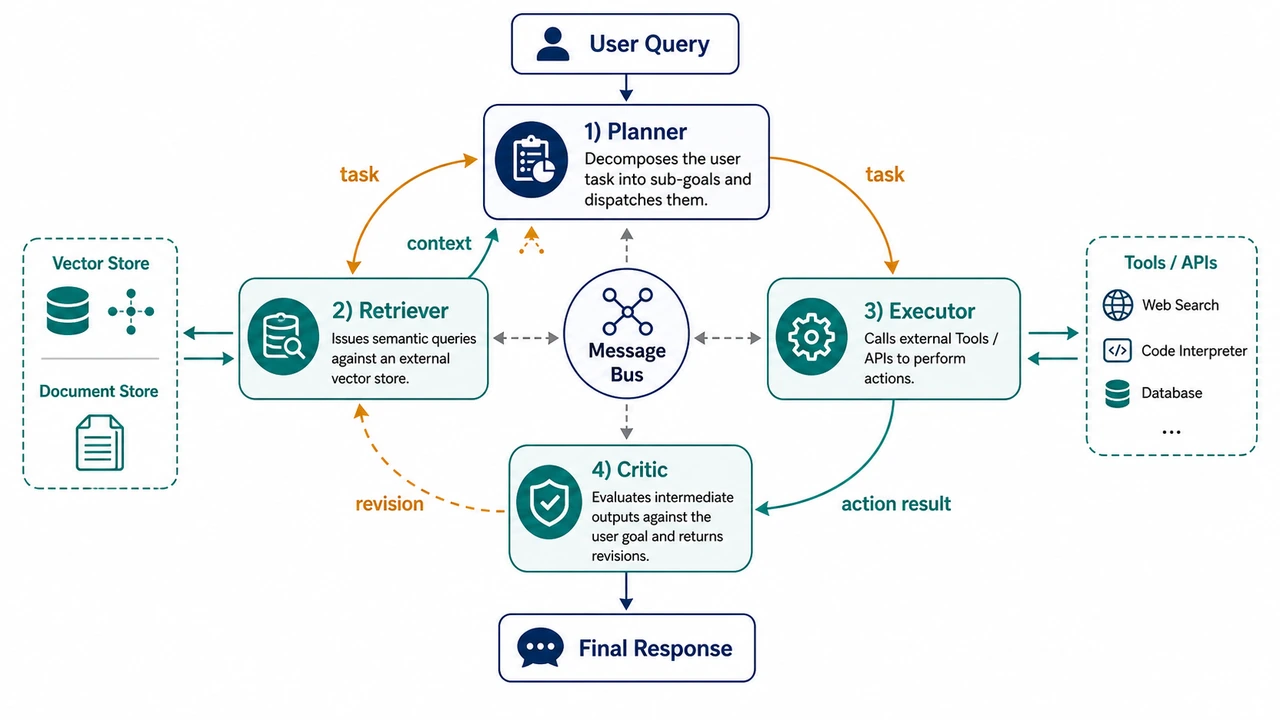
Multi-Agent Collaboration Framework
Closed-loop diagram with Planner, Retriever, Executor and Critic agents and an external knowledge base.
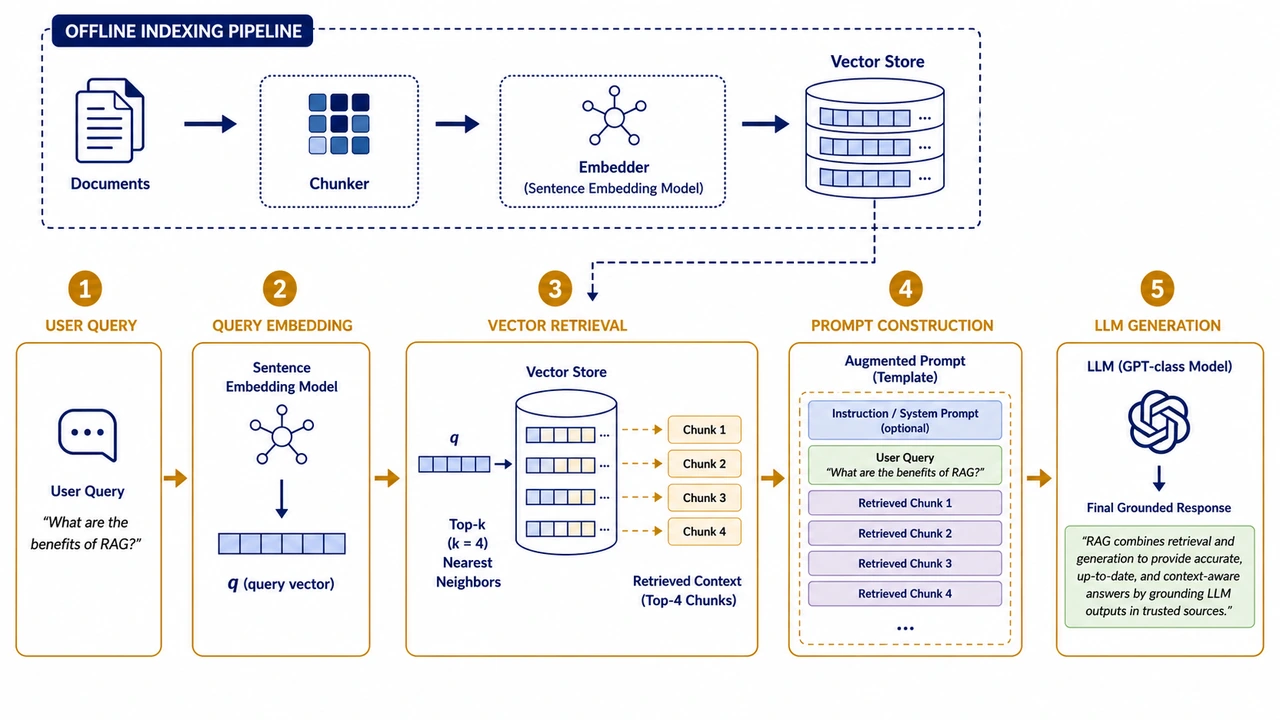
Retrieval-Augmented Generation (RAG) Pipeline
Query embedding, vector retrieval, prompt augmentation and LLM response generation.
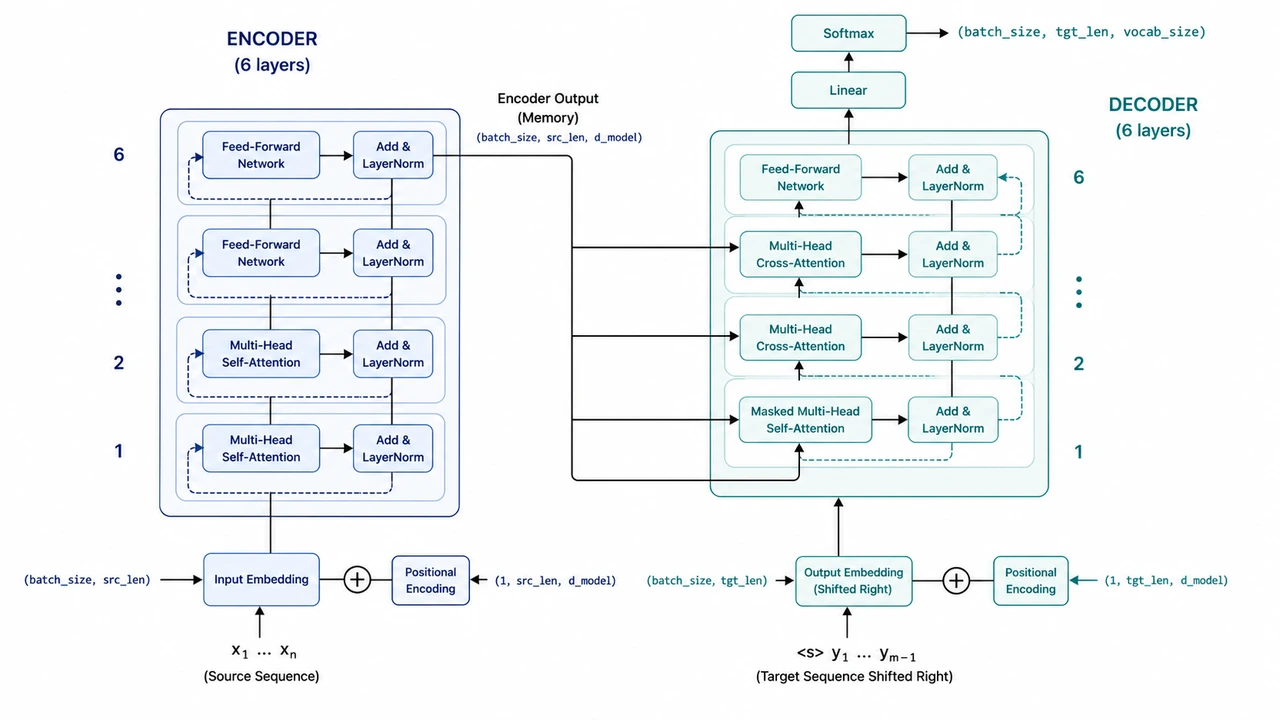
Transformer Encoder-Decoder Architecture
Publication-quality transformer block diagram with self-attention, cross-attention, and residual connections.
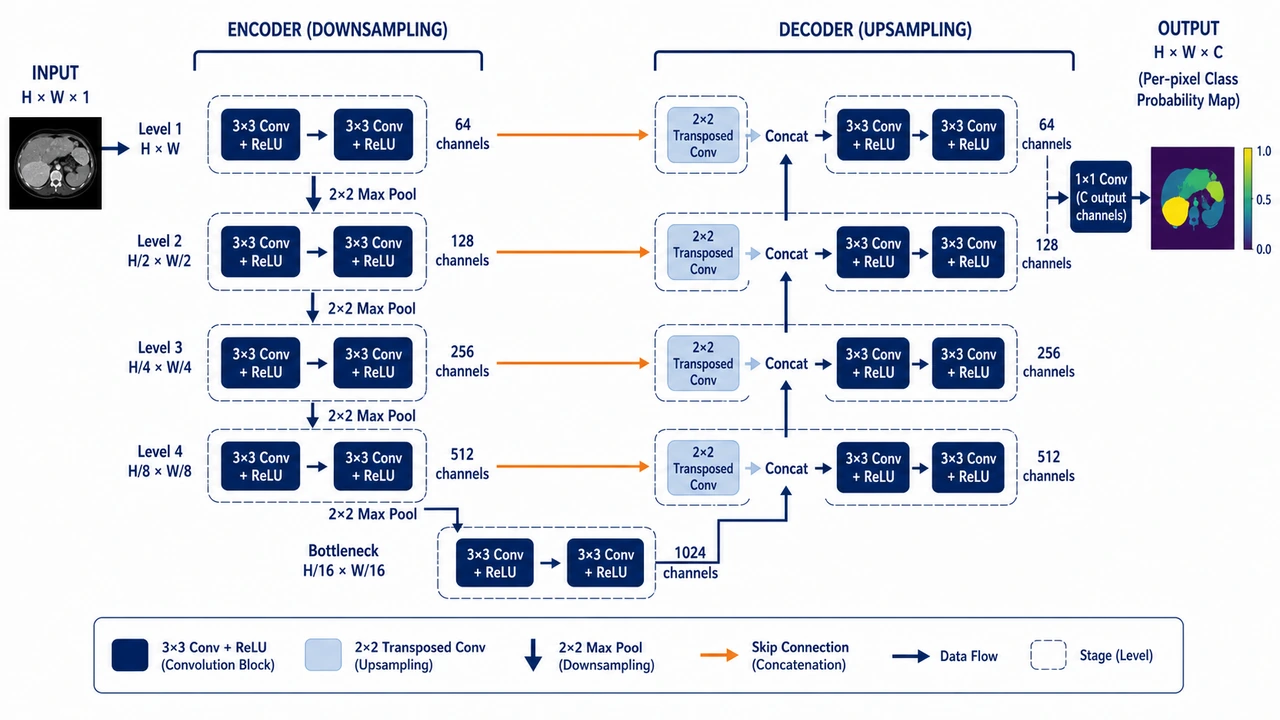
U-Net Encoder-Decoder for Segmentation
Symmetric encoder-decoder with skip connections for pixel-wise prediction.
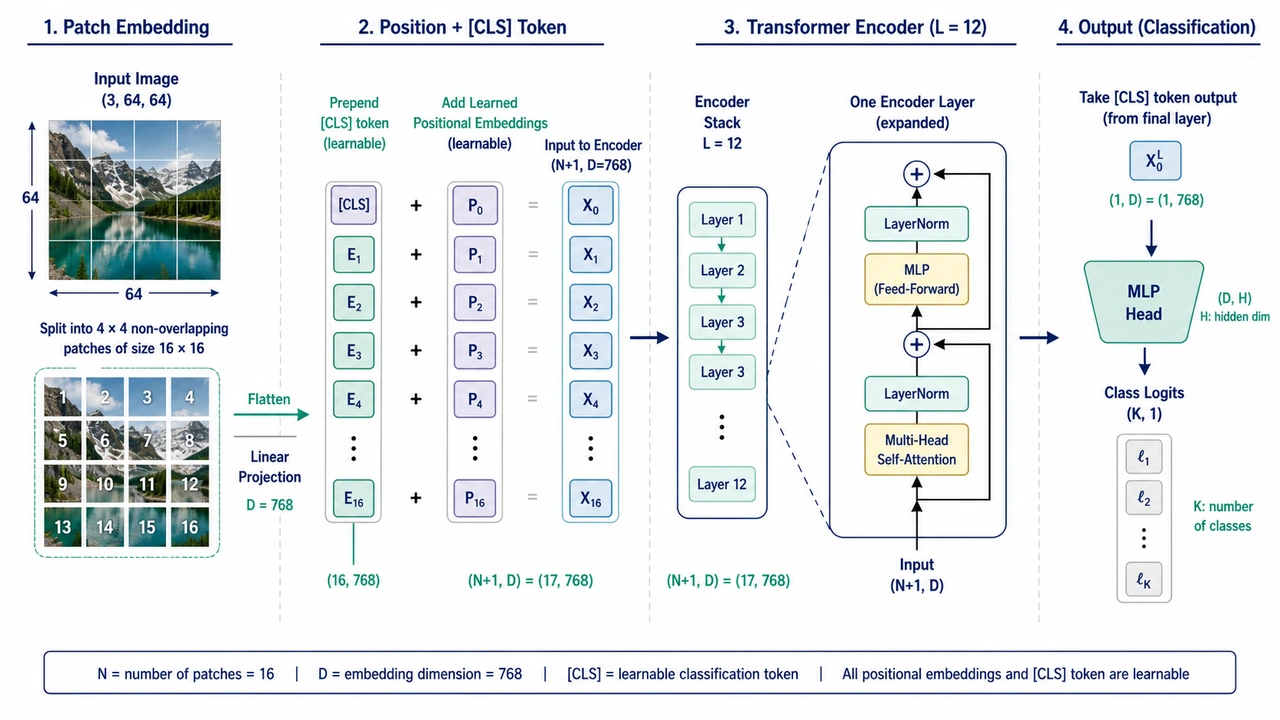
Vision Transformer (ViT) Architecture
Patch embedding, position encoding, transformer encoder stack and a classification head.
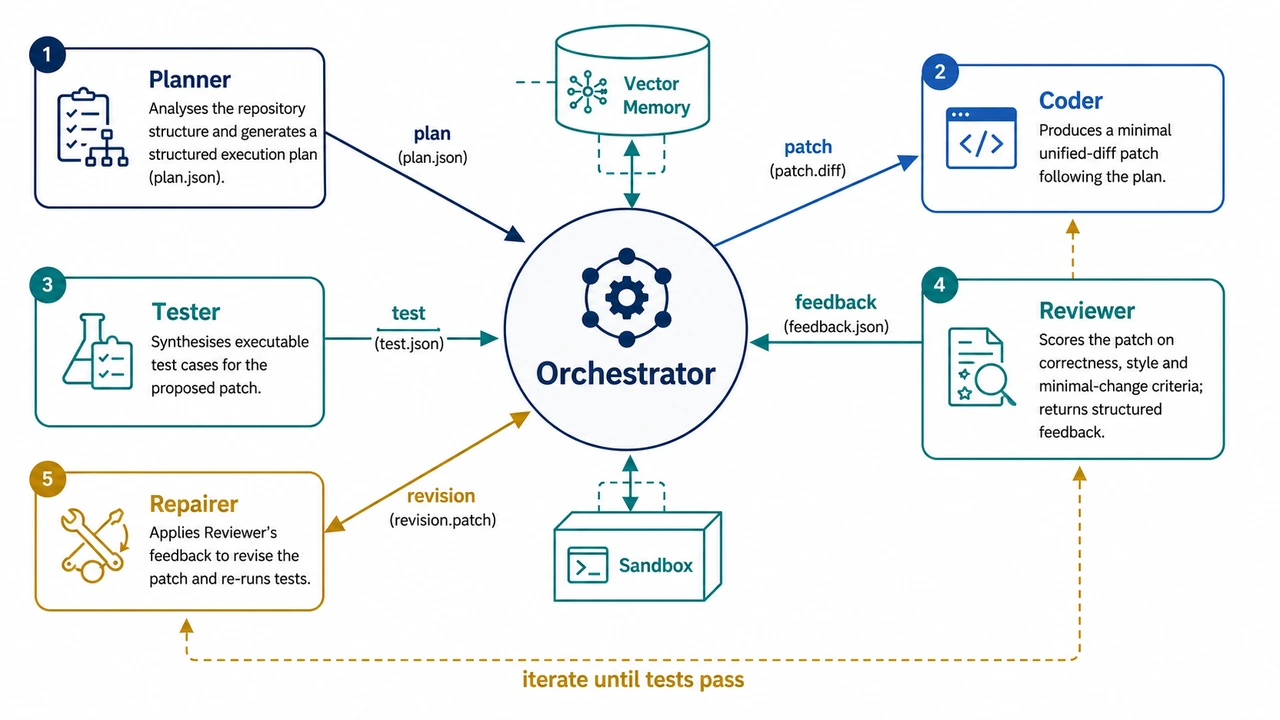
Multi-Agent Code-Generation Orchestrator
Planner / Coder / Tester / Reviewer agents coordinated by an orchestrator with shared memory.
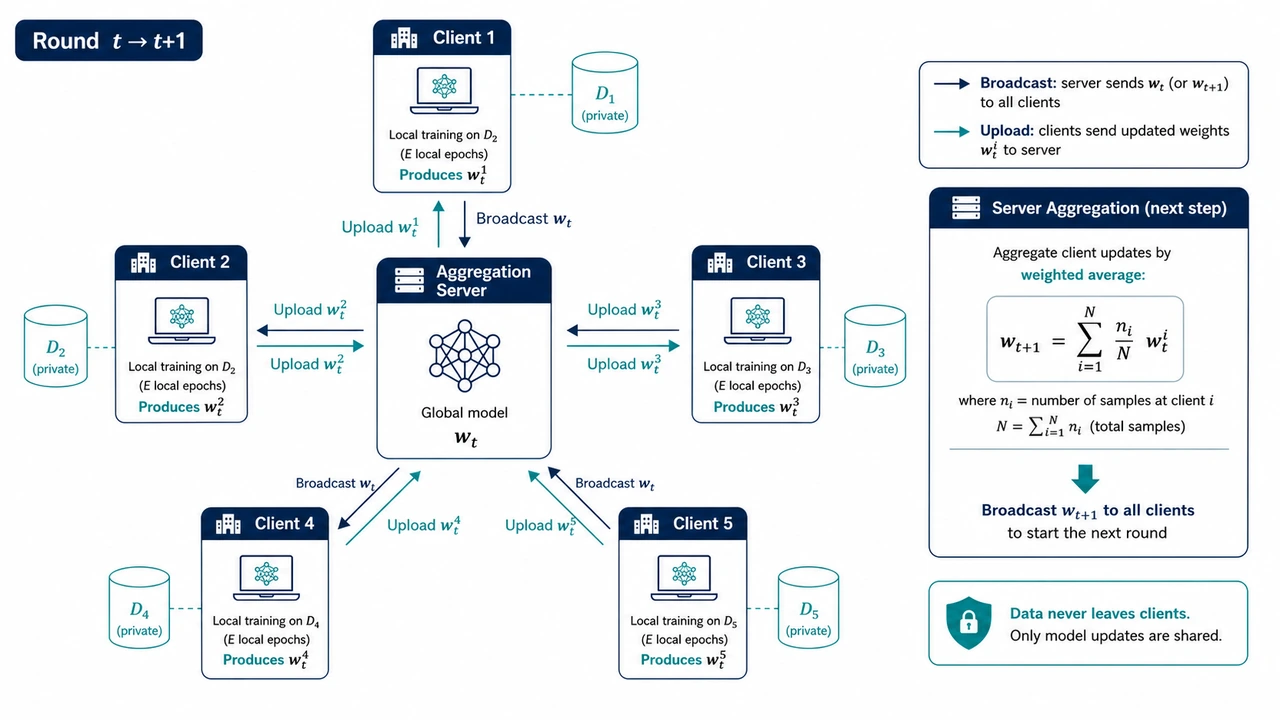
Federated Learning Round
Server orchestrates clients without seeing data — local training, weight upload, aggregation.
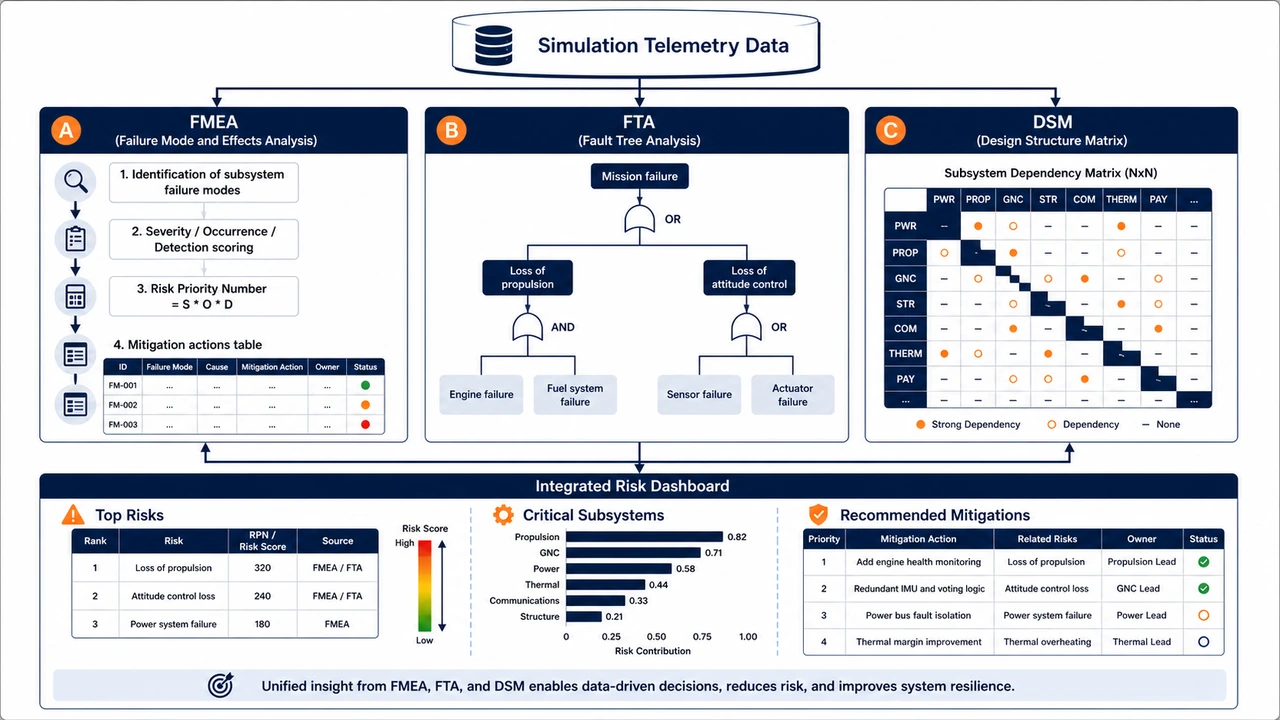
Risk Analysis Framework: FMEA / FTA / DSM
Three complementary risk analyses (failure mode, fault tree, dependency) sharing a simulation telemetry source.
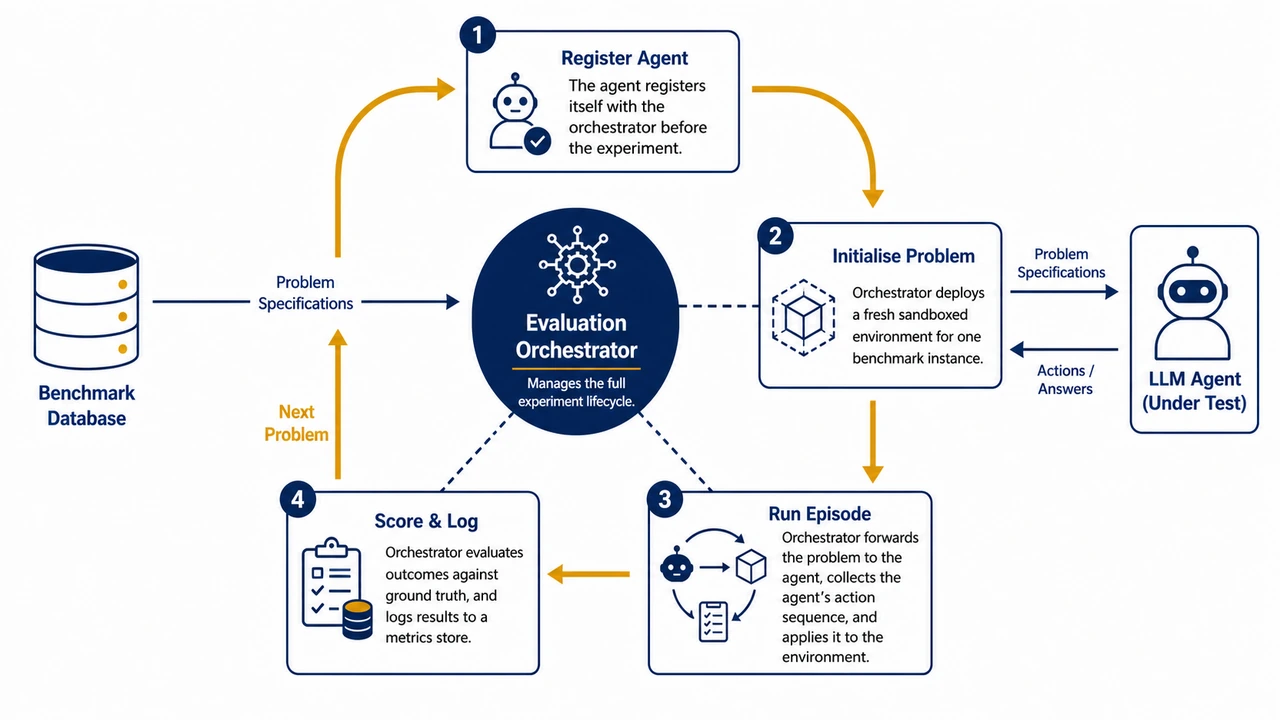
LLM Evaluation Framework
Closed-loop evaluation harness running an LLM agent against benchmark problems with deployment, scoring and reporting.
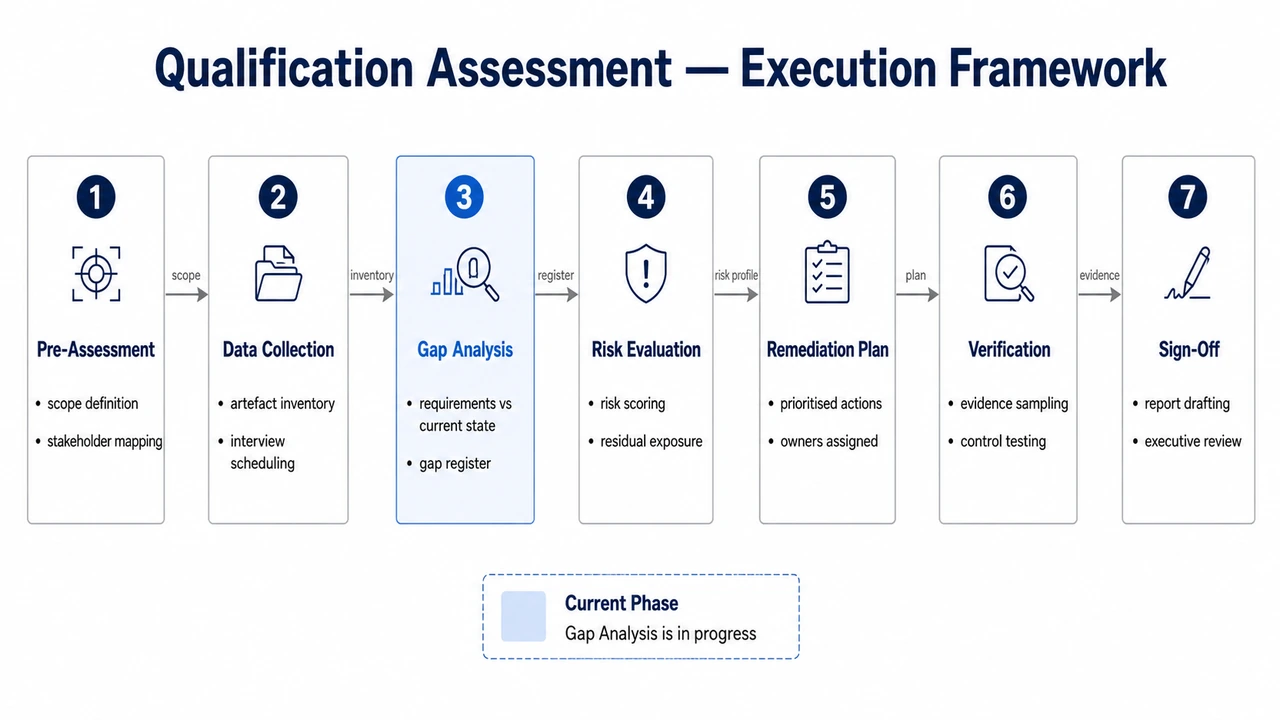
Multi-Phase Qualification Framework
Seven sequential qualification phases with phase number, name and 2-3 short activities each.
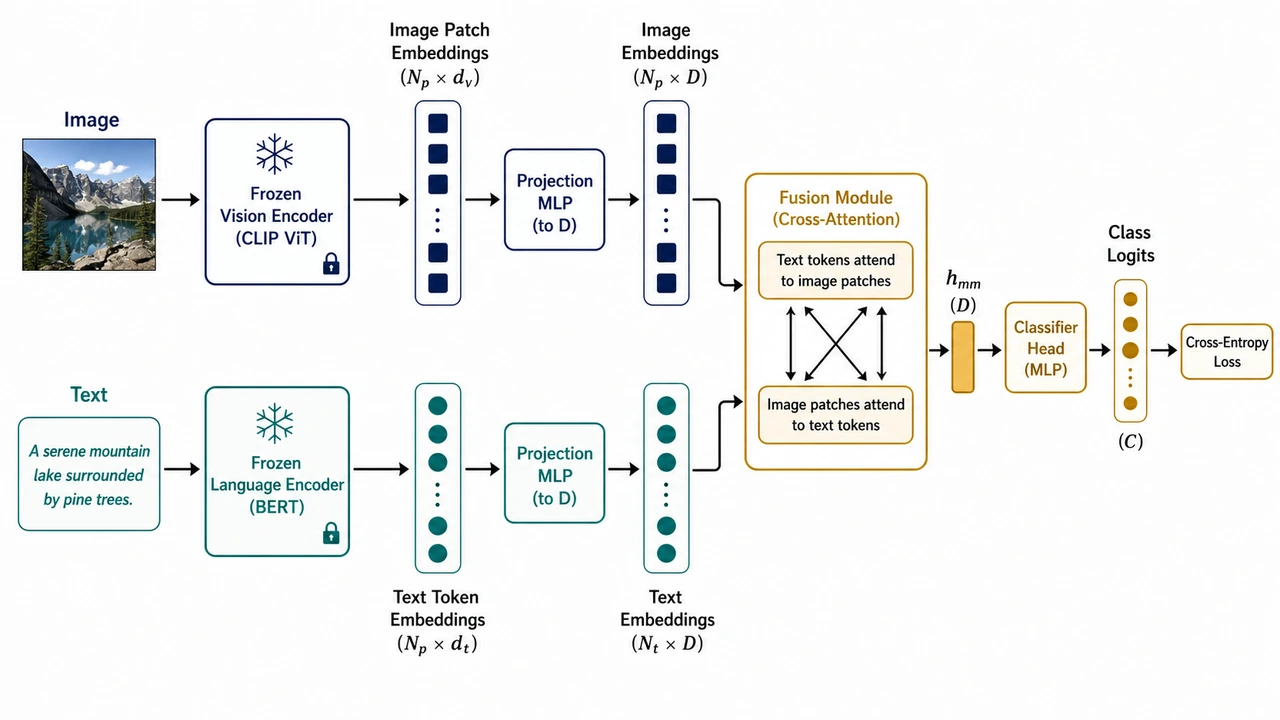
Multimodal Fusion Pipeline (Image + Text)
Per-modality encoders, projection to a shared space, fusion module and a downstream classifier.
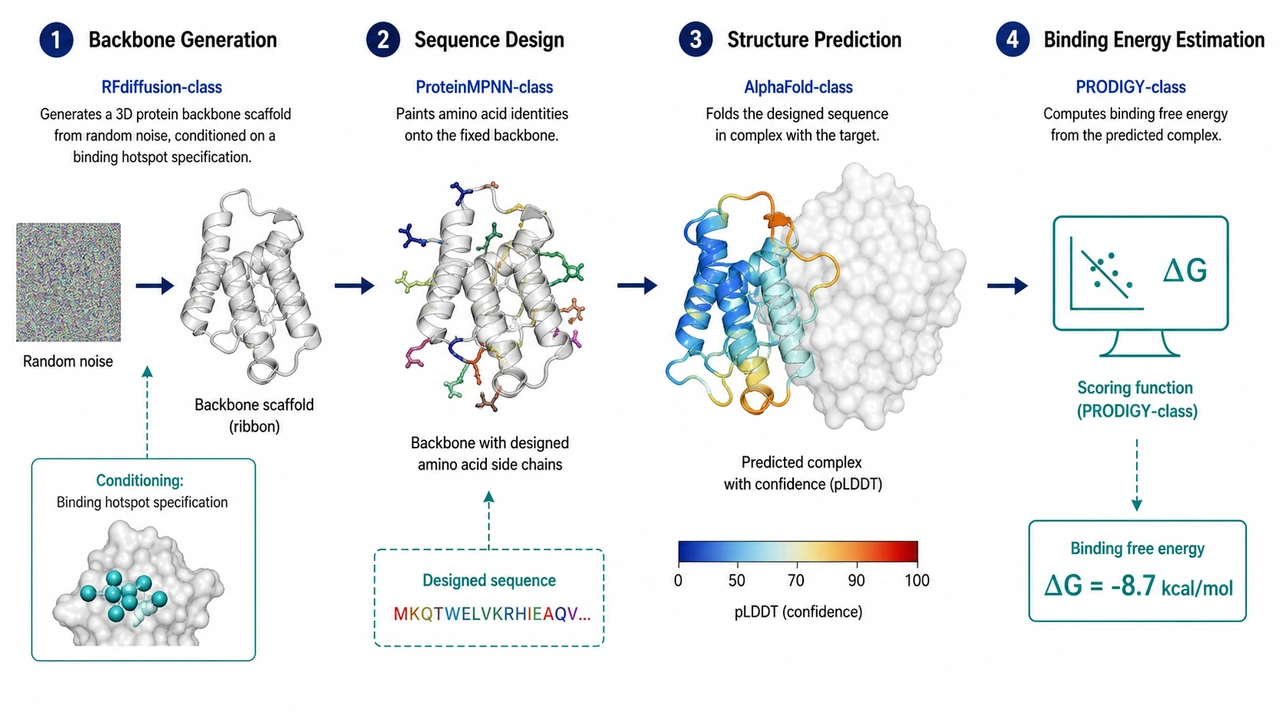
AI Protein Design Workflow
Backbone generation, sequence painting, structure prediction and binding-energy calculation.
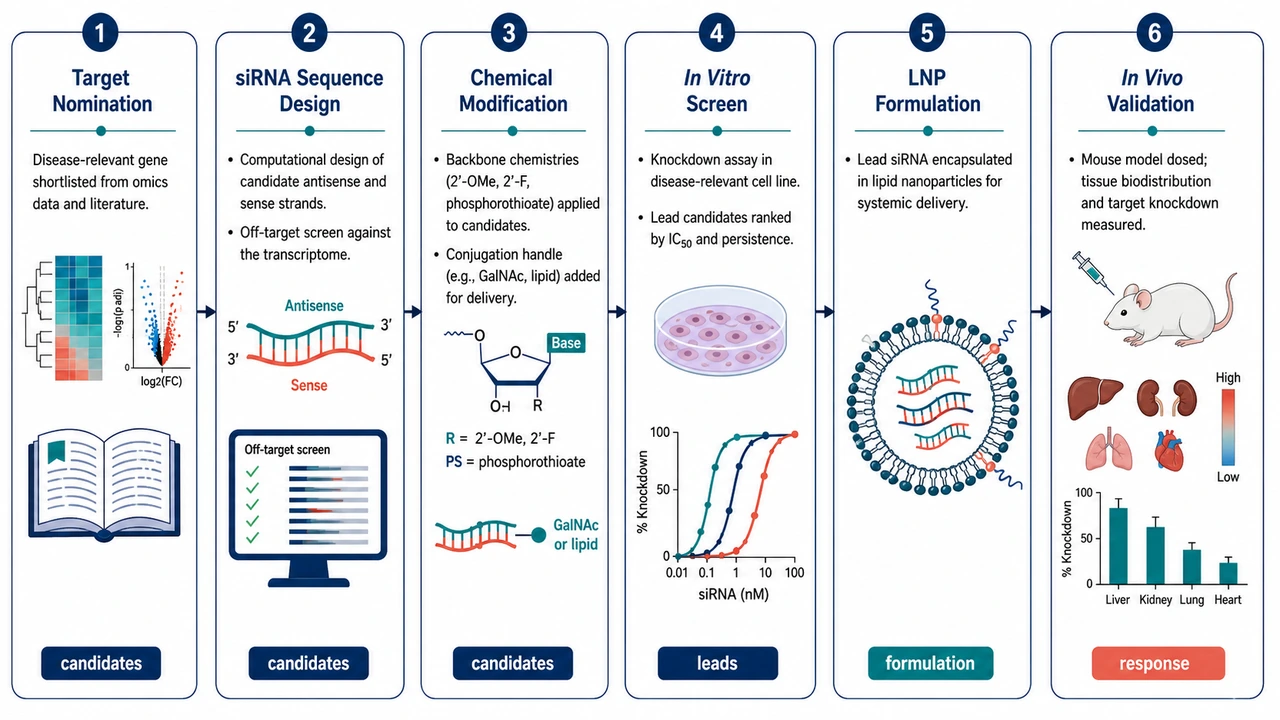
Therapeutic siRNA Design Pipeline
End-to-end siRNA discovery from target nomination to LNP-formulated in vivo delivery.
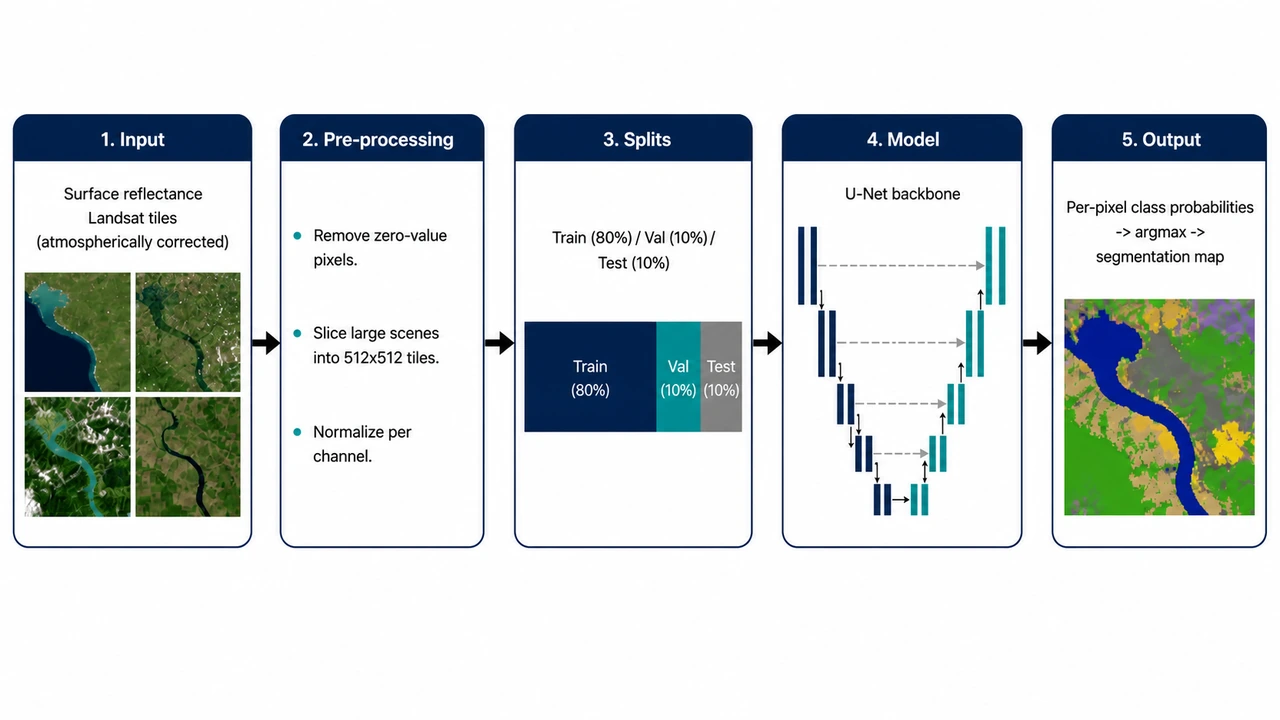
End-to-End Segmentation Training Pipeline
Five-stage horizontal pipeline from raw satellite tiles to pixel-wise predictions.
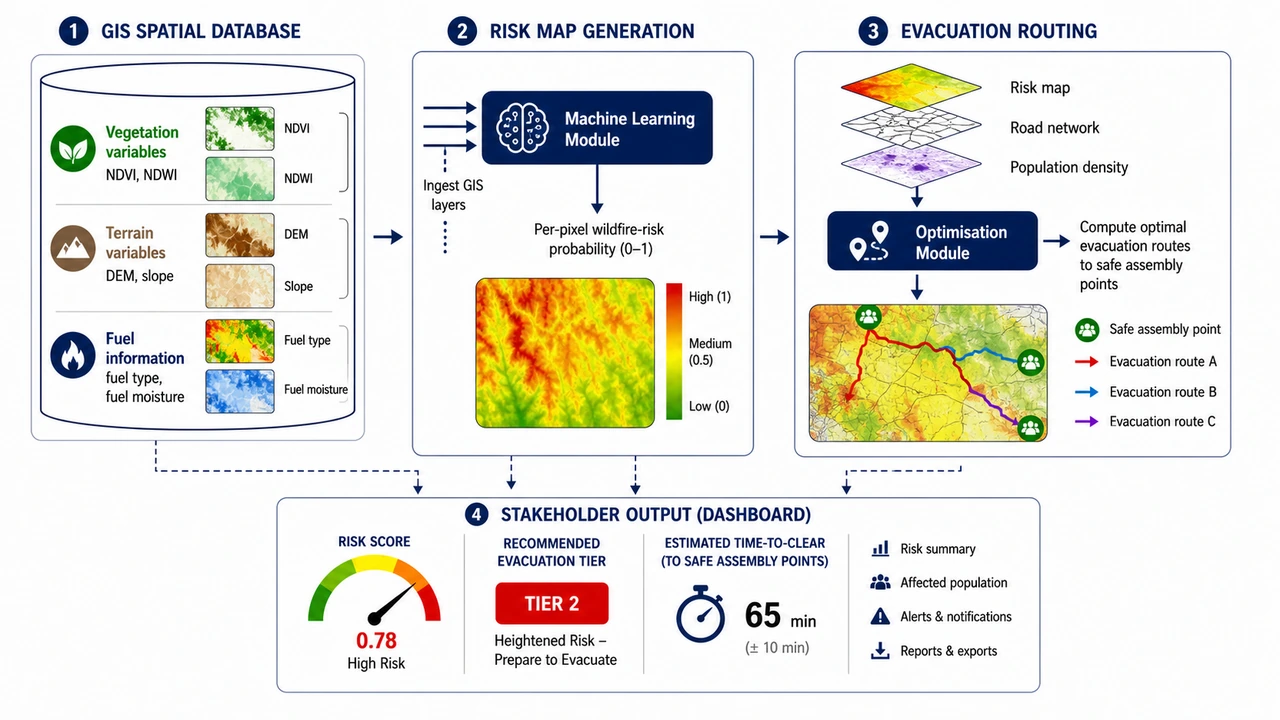
Wildfire Risk & Evacuation Framework
GIS spatial database fuels a risk-map module that drives evacuation routing.
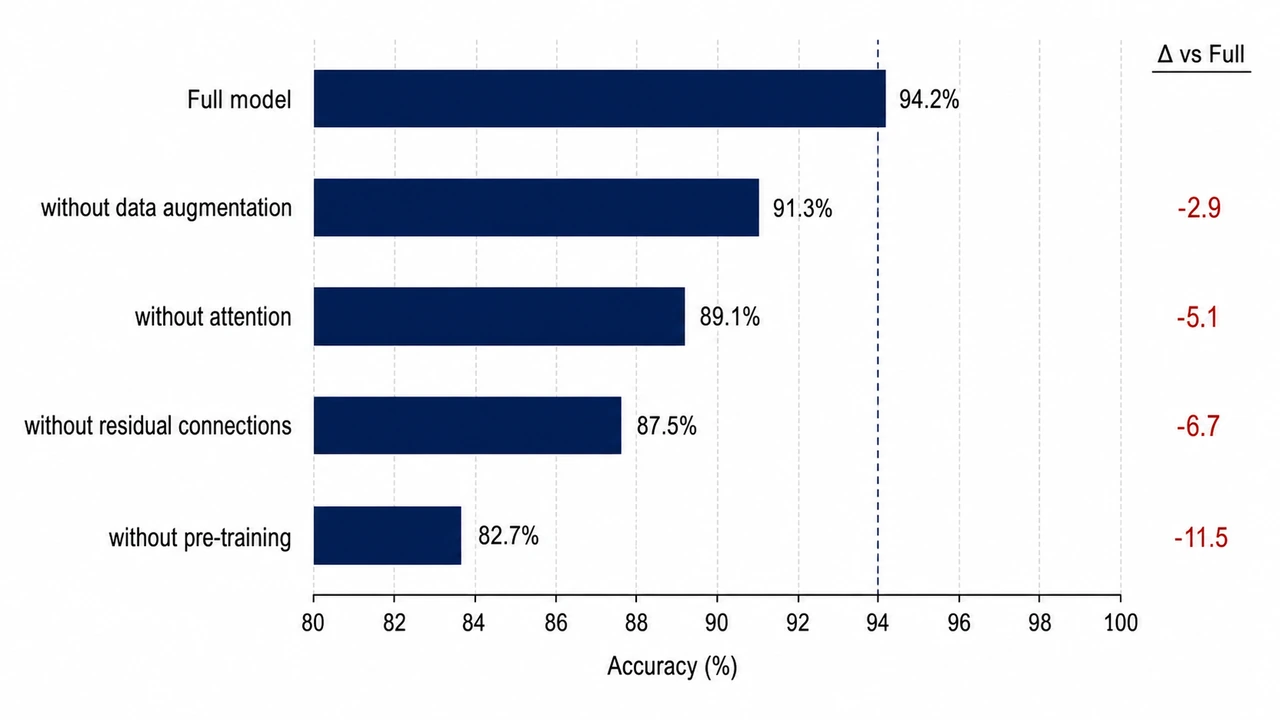
Ablation Study Horizontal Bar Chart
Sorted horizontal bars showing the contribution of each component to overall accuracy.
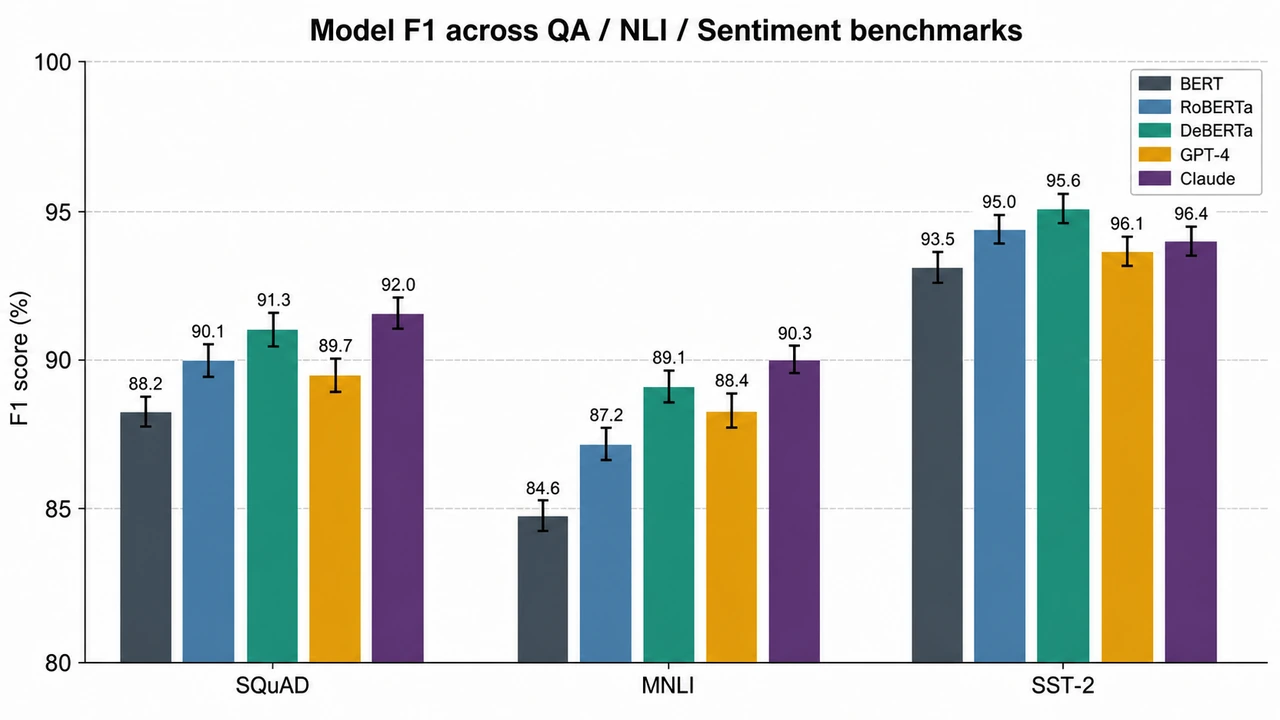
Model Benchmark Grouped Bar Chart
Publication-quality grouped bar chart comparing models across multiple benchmarks with error bars.
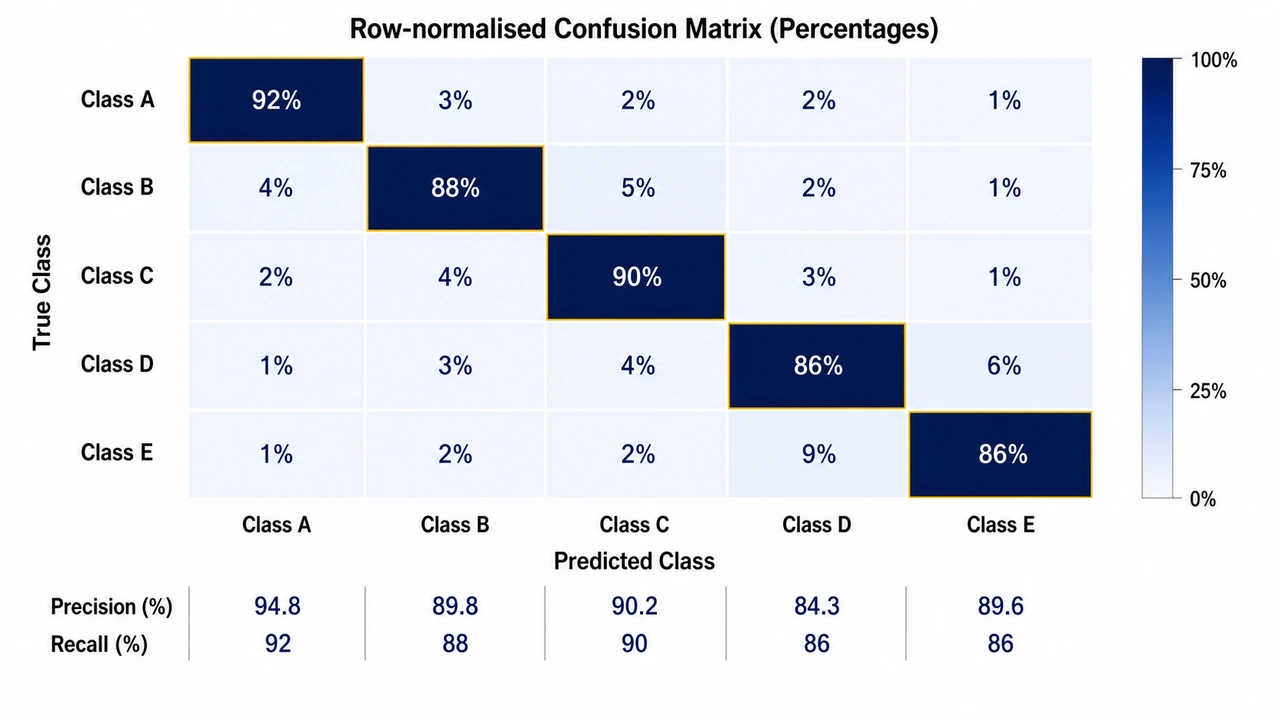
Confusion Matrix Heatmap
Square heatmap showing predicted-vs-true counts with row-normalised colors and value annotations.
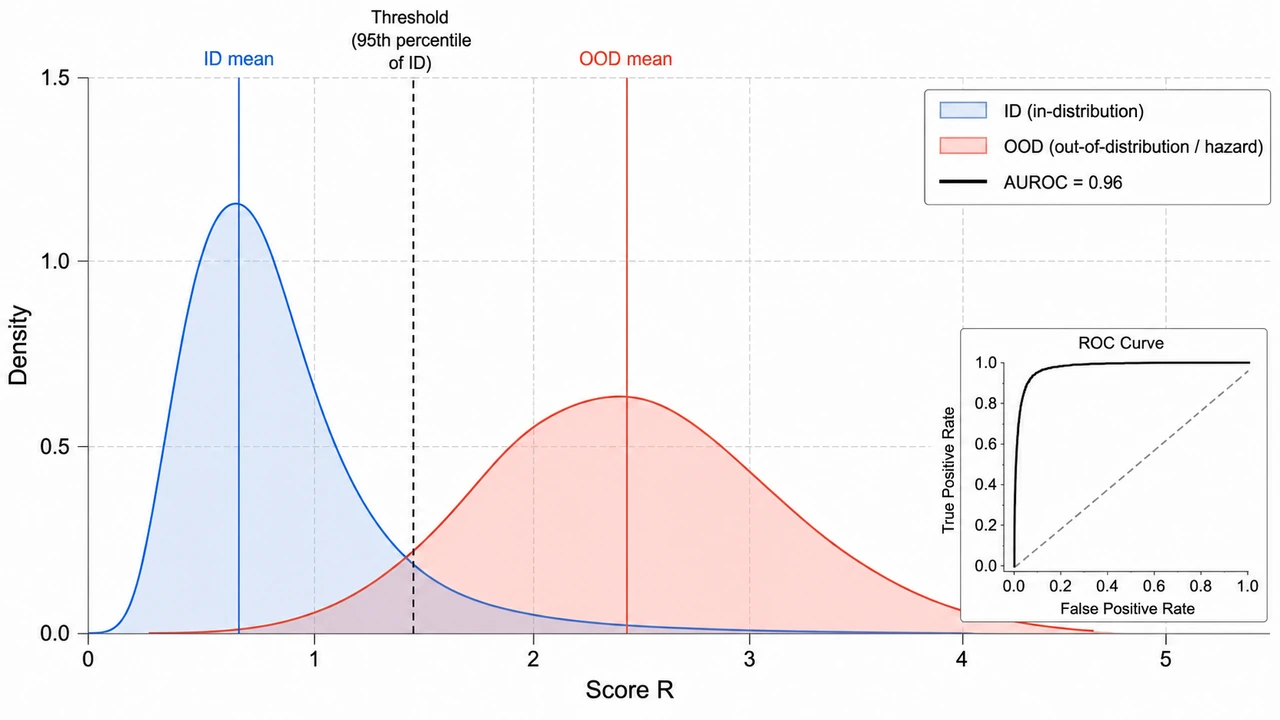
ID vs OOD Score Distributions
Two overlapping kernel density curves showing ID/OOD separability with mean markers and threshold line.
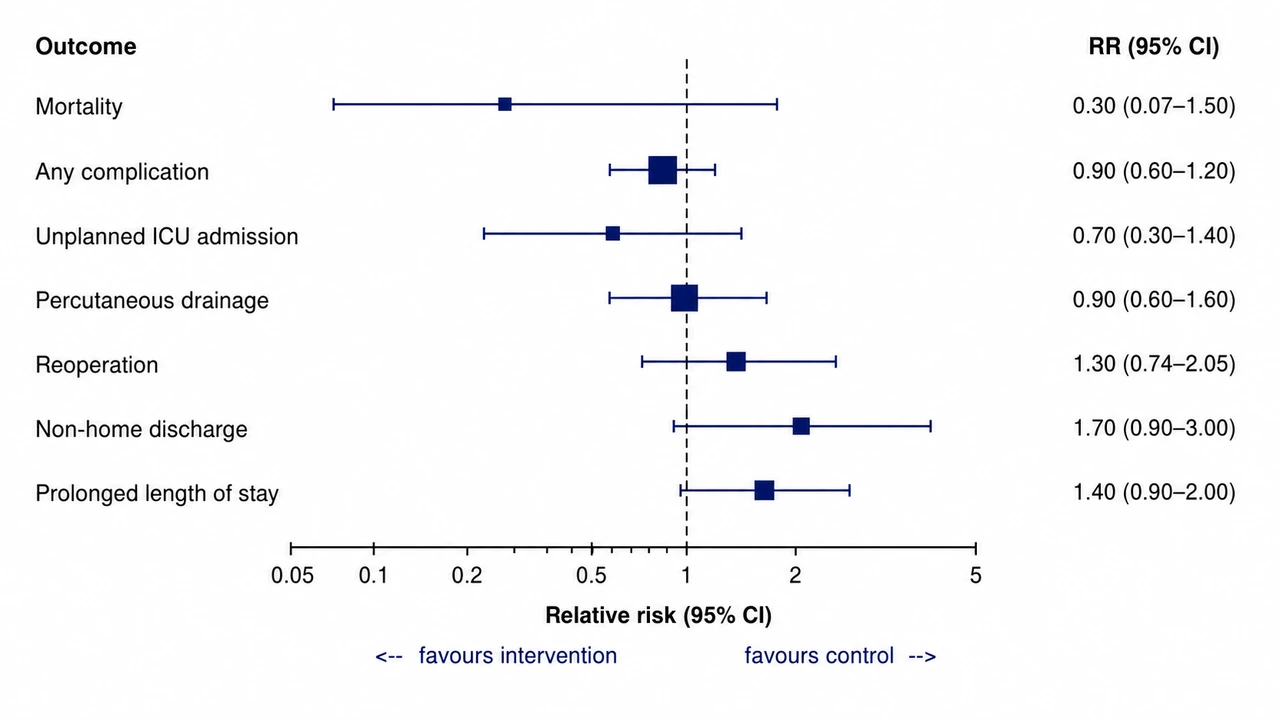
Clinical Outcomes Forest Plot
Forest plot of relative risks with 95% CI for surgical complications.
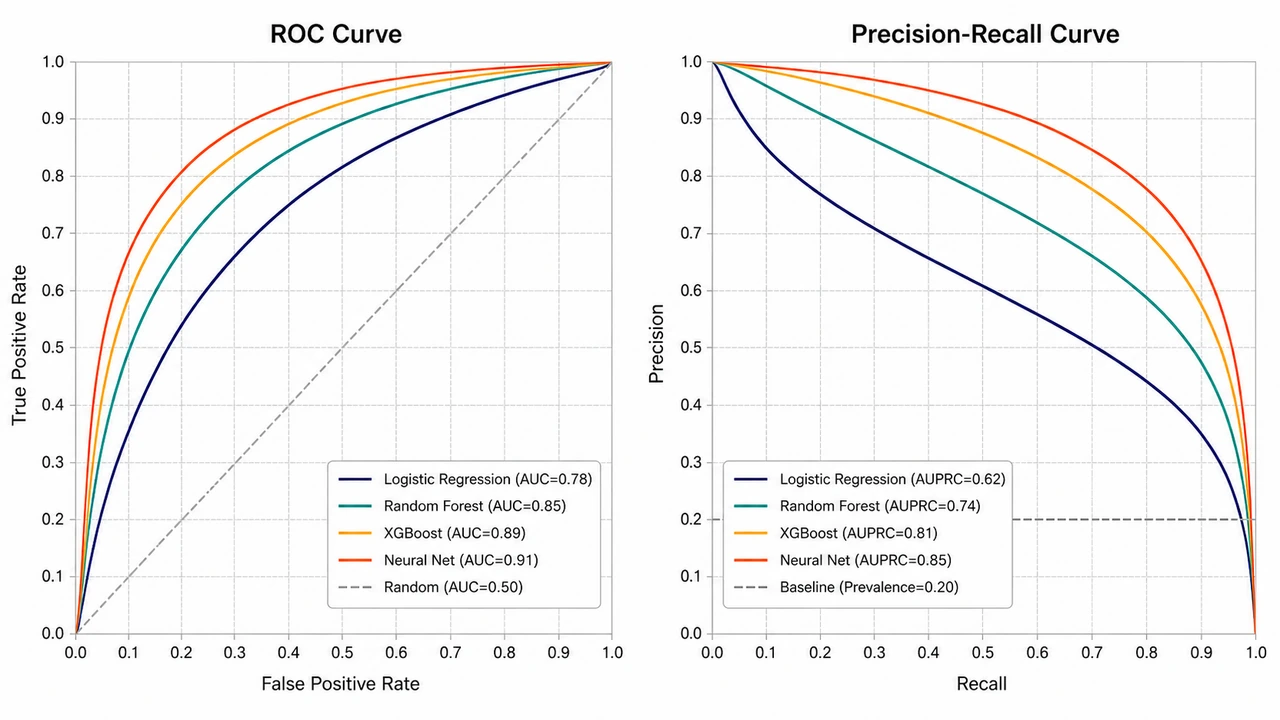
ROC and Precision-Recall Curve Overlay
Two-panel ROC + PR curves overlaying multiple models on one chart for comparison.
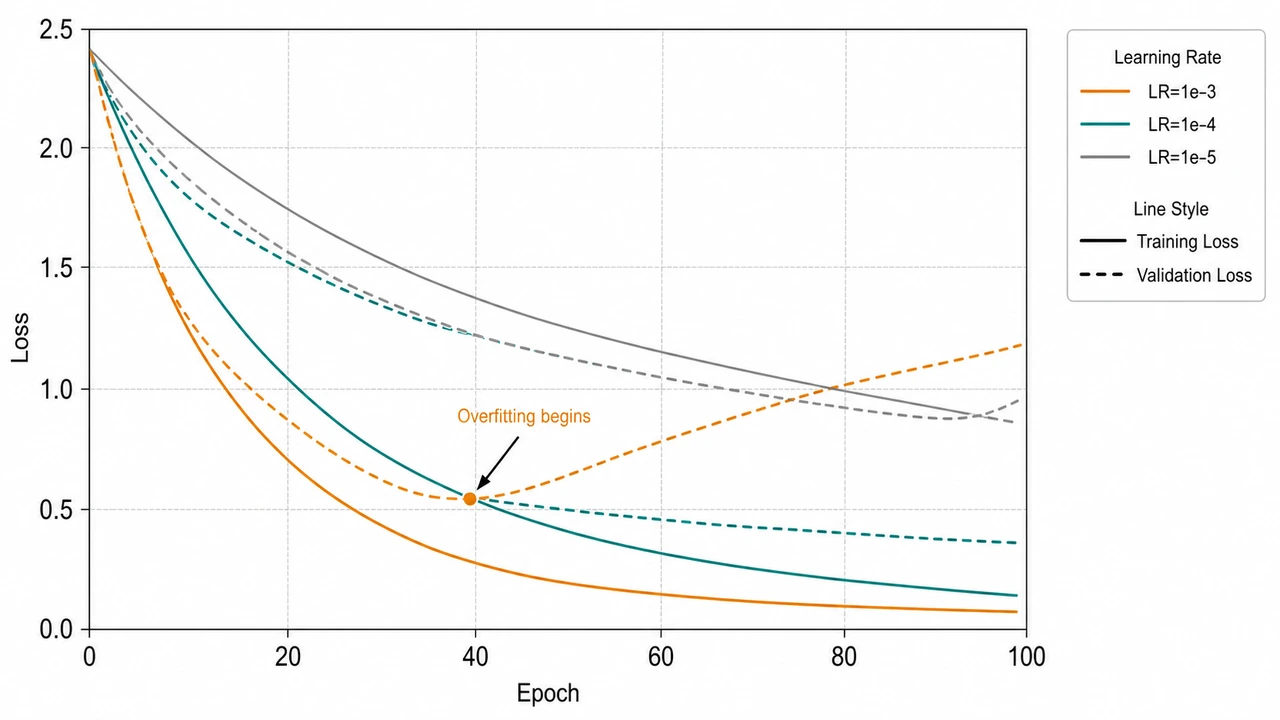
Training & Validation Loss Curve
Multi-LR loss curve over epochs with overfitting clearly visible on the high-LR run.
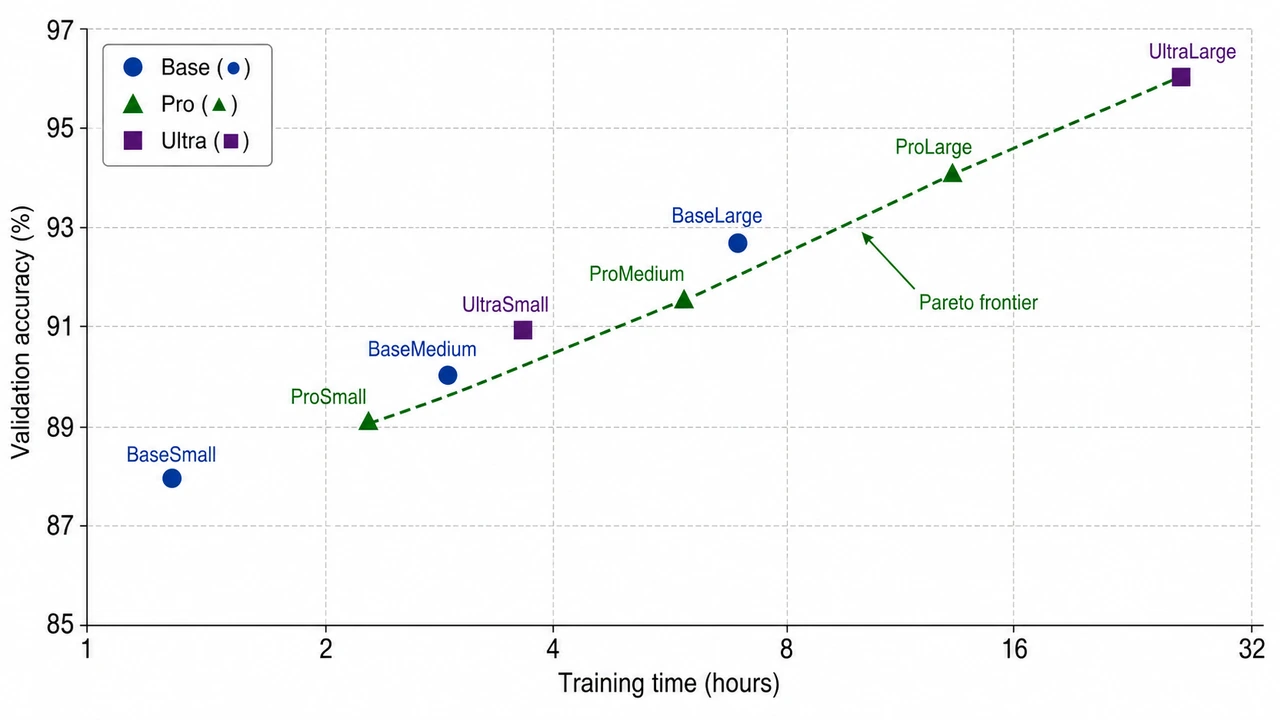
Training Time vs Accuracy Trade-off
Scatter plot of training time (x) vs validation accuracy (y) with Pareto frontier highlighted.