50% OFF annual plans

Paper Banana - Editable AI Academic Illustration Generator

Paper Banana AI turns method text, experiment results, prompt templates, sketches, or references into clear, editable academic illustrations for papers, posters, grants, and slides. Use Paper Banana to draft a checkable first version before export.

Open research reference: 5 agents · 292 NeurIPS 2025 cases · 4 evaluation criteria

Academic illustration preview
Preview

Your generated paper figure will appear here. Review the labels and refine the final version before publication.

Method section to editable academic illustration workflow

Paper Banana Academic Illustration Examples

Explore Paper Banana examples for model architectures, method workflows, evaluation panels, and dense paper-style academic illustrations. Pick a close Paper Banana prompt, then continue editing the result in Paper Banana.

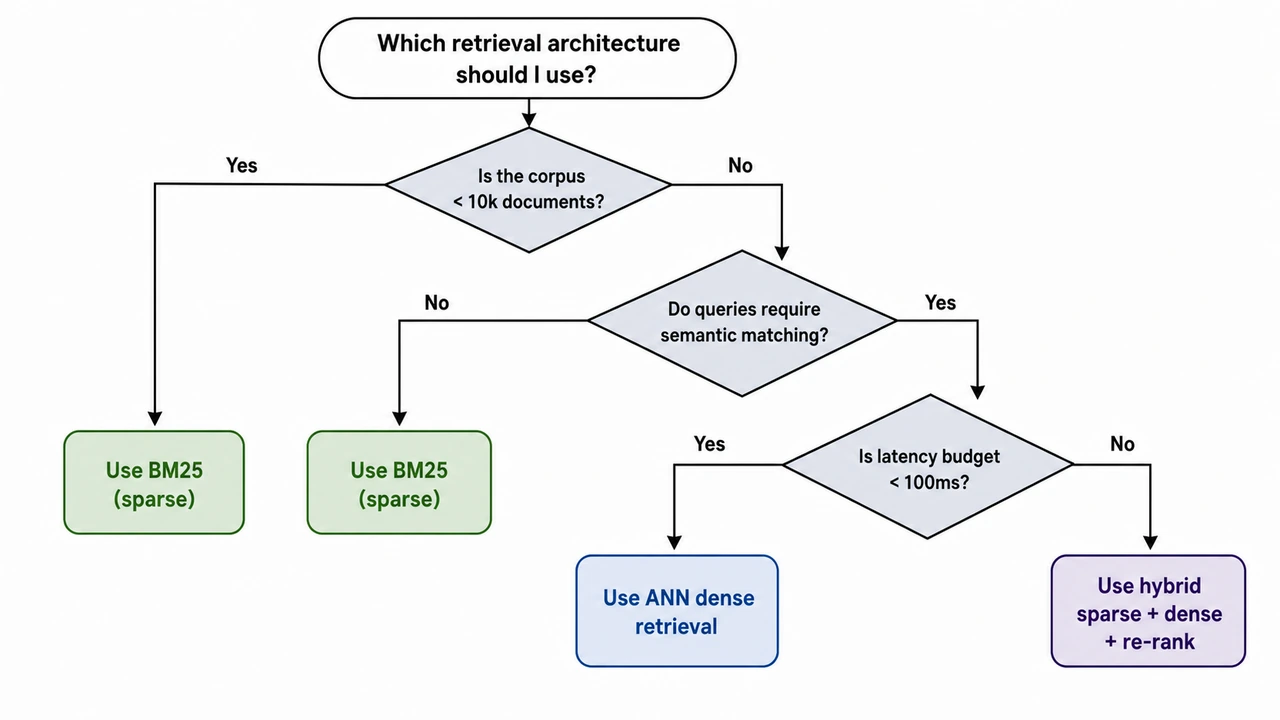
Decision-Tree Selection Workflow

Decision-Tree Selection Workflow

A decision-tree selection workflow drawn top-down. Top — Starting Question (oval node): "Which retrieval architecture should I use?" Three sequential decision nodes (diamonds) below, each binary: Q1 — "Is the corpus < 10k documents?" - Yes -> "Use BM25 (sparse)" (leaf, green) - No -> continue to Q2 Q2 — "Do queries require semantic matching?" - No -> "Use BM25 (sparse)" (leaf, green) - Yes -> continue to Q3 Q3 — "Is latency budget < 100ms?" - Yes -> "Use ANN dense retrieval" (leaf, blue) - No -> "Use hybrid sparse + dense + re-rank" (leaf, purple) Three colored leaf nodes at the bottom showing the recommendations. Style: clean academic vector, white background, restrained palette (slate diamonds, green / blue / purple leaves), sans-serif. Branch labels ("Yes" / "No") on every edge. Optimised for poster and slide readability.

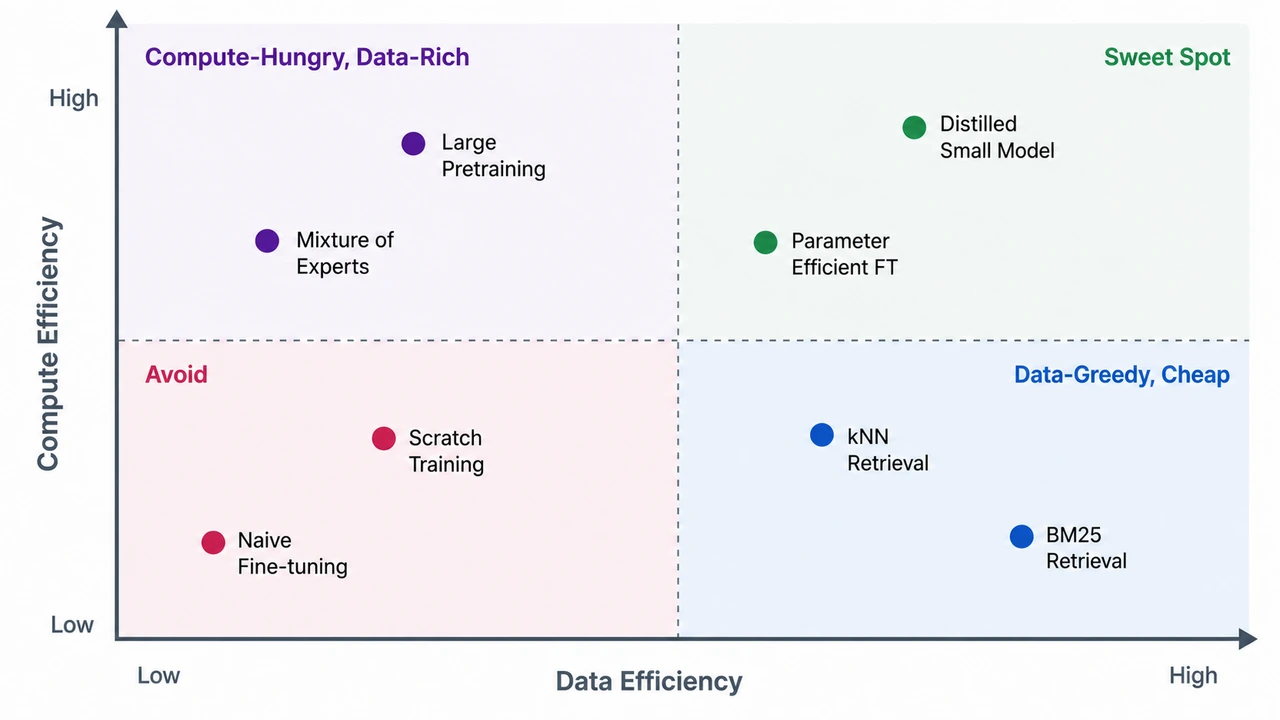
Four-Quadrant Positioning Matrix

Four-Quadrant Positioning Matrix

A 2x2 positioning matrix with two axes and four labeled quadrants. Axes: - X-axis (horizontal): "Data Efficiency" — left = low, right = high - Y-axis (vertical): "Compute Efficiency" — bottom = low, top = high Four quadrants: - Top-left: "Compute-Hungry, Data-Rich" — methods that need lots of compute and tolerate data scarcity (e.g., huge pretraining) - Top-right: "Sweet Spot" — high efficiency on both axes (e.g., distilled small models) - Bottom-left: "Avoid" — both inefficient (e.g., naive scratch training) - Bottom-right: "Data-Greedy, Cheap" — needs lots of data but cheap to run (e.g., kNN retrieval) Plot 6-8 example methods as labeled dots distributed across all four quadrants. Each dot has a 1-2 word label. Style: clean publication-style scatter, white background, slate axes with one accent color per quadrant, sans-serif. Quadrant headers in upper-corner of each quadrant. Suitable for survey papers and consultancy decks.

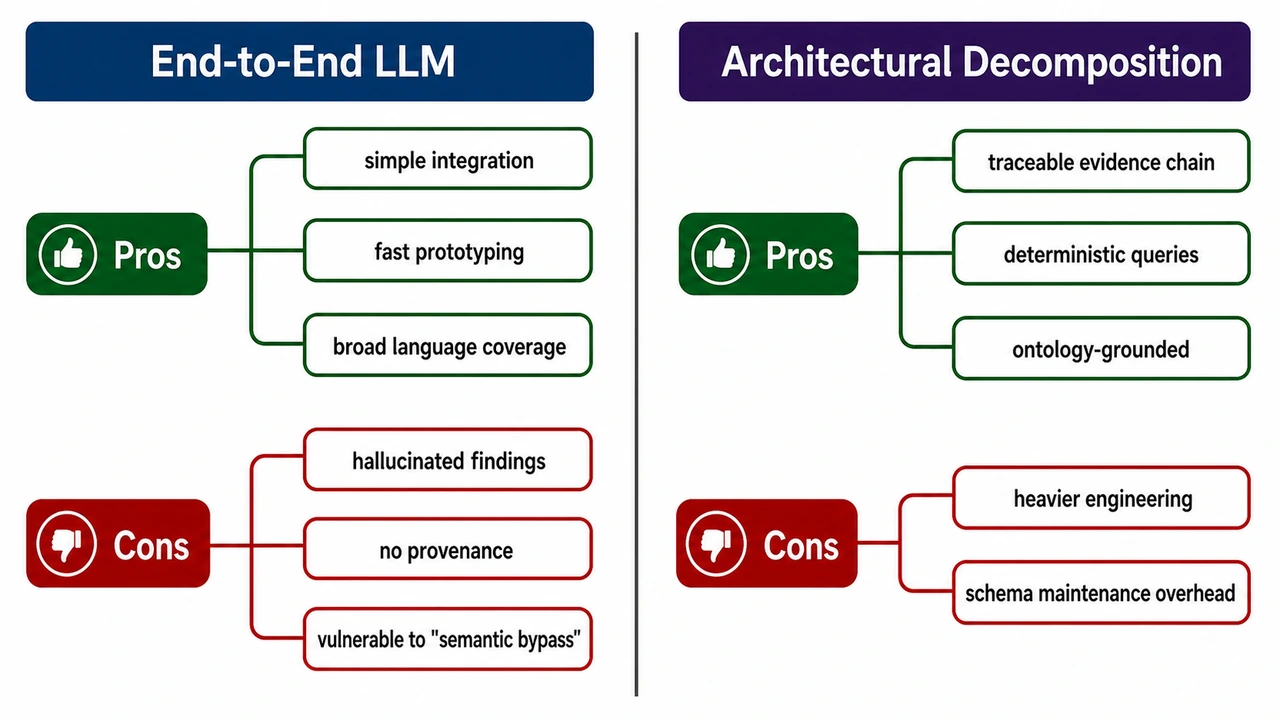
Method Comparison Mind Map (Pros vs Cons)

Method Comparison Mind Map (Pros vs Cons)

A horizontal mind-map comparing two approaches for vulnerability discovery in source code. Left side: "End-to-End LLM" Right side: "Architectural Decomposition" Each side has two color-coded branches: - Pros (dark green) - Cons (dark red) End-to-End LLM Pros: simple integration; fast prototyping; broad language coverage. Cons: hallucinated findings; no provenance; vulnerable to "semantic bypass". Architectural Decomposition Pros: traceable evidence chain; deterministic queries; ontology-grounded. Cons: heavier engineering; schema maintenance overhead. Layout: central vertical divider; method title at top of each side in a colored header bar; pros branches above, cons below. Use clean rounded labels, generous whitespace, sans-serif typography. Optimize for poster readability. White background.

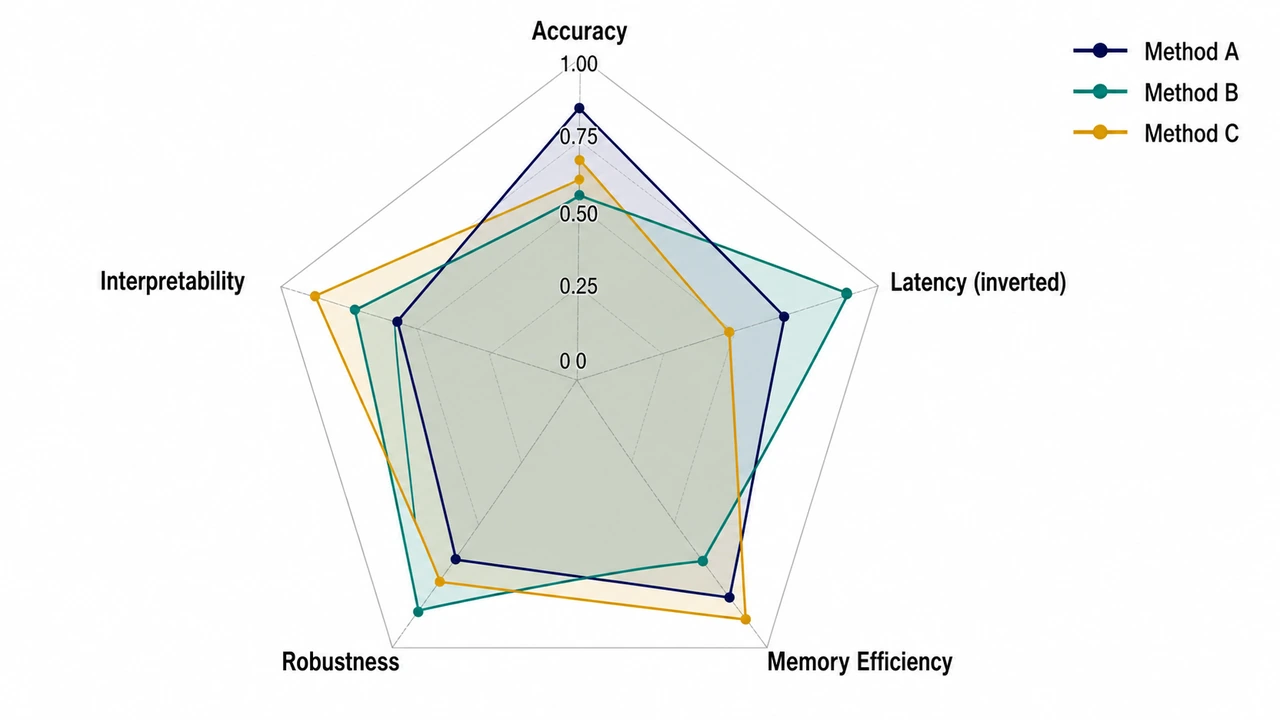
Method Comparison Radar Chart

Method Comparison Radar Chart

A radar (spider) chart comparing three methods on five evaluation dimensions. Five axes (radiating from center, going clockwise from top): 1. Accuracy 2. Latency (inverted: higher = lower latency) 3. Memory Efficiency 4. Robustness 5. Interpretability Three methods plotted as colored polygons: - Method A (navy fill at 25% opacity, navy border) - Method B (teal fill at 25% opacity, teal border) - Method C (amber fill at 25% opacity, amber border) Numeric scores 0-1 along each axis, with grid rings at 0.25 / 0.50 / 0.75 / 1.00. Legend top-right with the three methods and their colors. Style: clean academic radar chart, white background, restrained palette, sans-serif labels. Optimise for legibility on a poster.

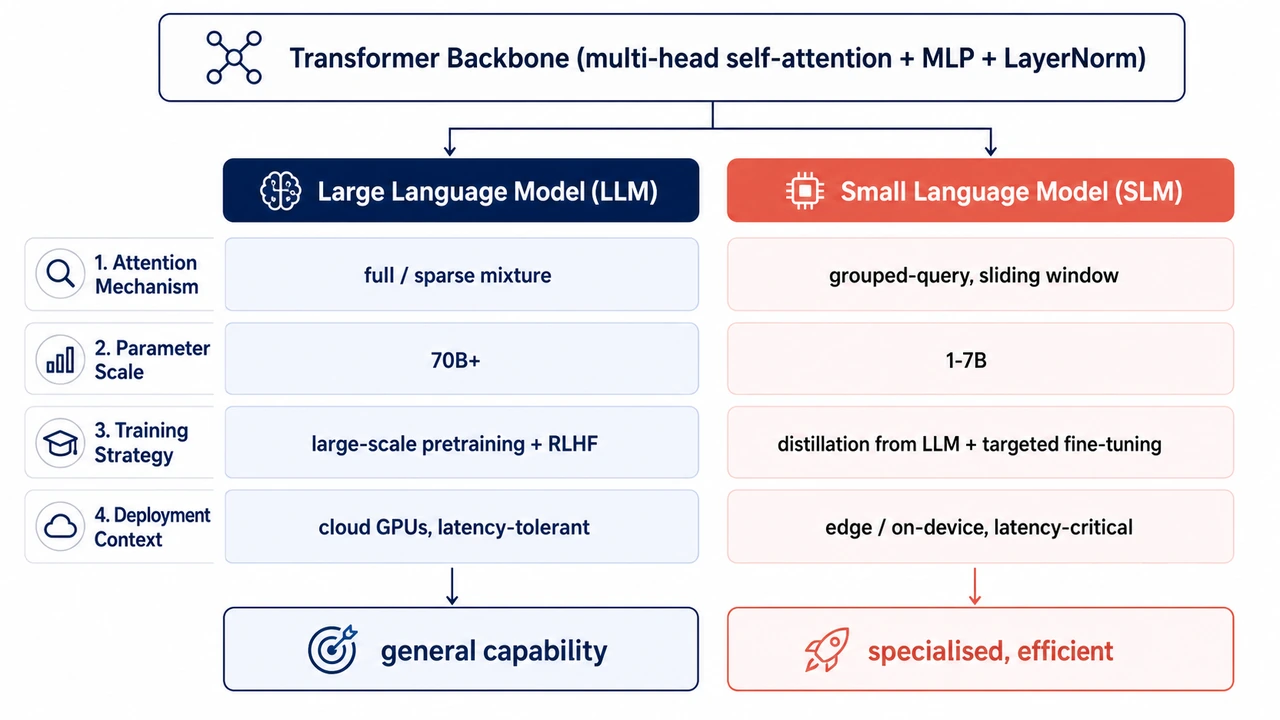
Shared-Foundation, Divergent-Choices Comparison

Shared-Foundation, Divergent-Choices Comparison

Create a clean comparison diagram titled "Shared Foundation, Divergent Choices" for an academic paper. Layout: - Top: one wide shared foundation block labeled "Shared pretraining foundation" with small icons for data, tokenizer, transformer layers, and optimization. - From the shared block, split into two parallel columns: "System A" and "System B". - Add four comparison rows: Attention pattern, Model scale, Training objective, Deployment context. - Each row should show matched but divergent choices, connected back to the shared foundation with subtle branching arrows. - Bottom: two outcome boxes labeled "Efficiency / controllability" and "Capability / generalization". Style: - Publication-ready vector-like diagram on white background. - Navy foundation block, teal System A accents, coral System B accents, neutral gray dividers. - Use concise labels only, maximum 6 words per cell. - Include small schematic icons but no decorative clutter. - Sans-serif typography, high contrast, suitable for a methods or related-work figure.

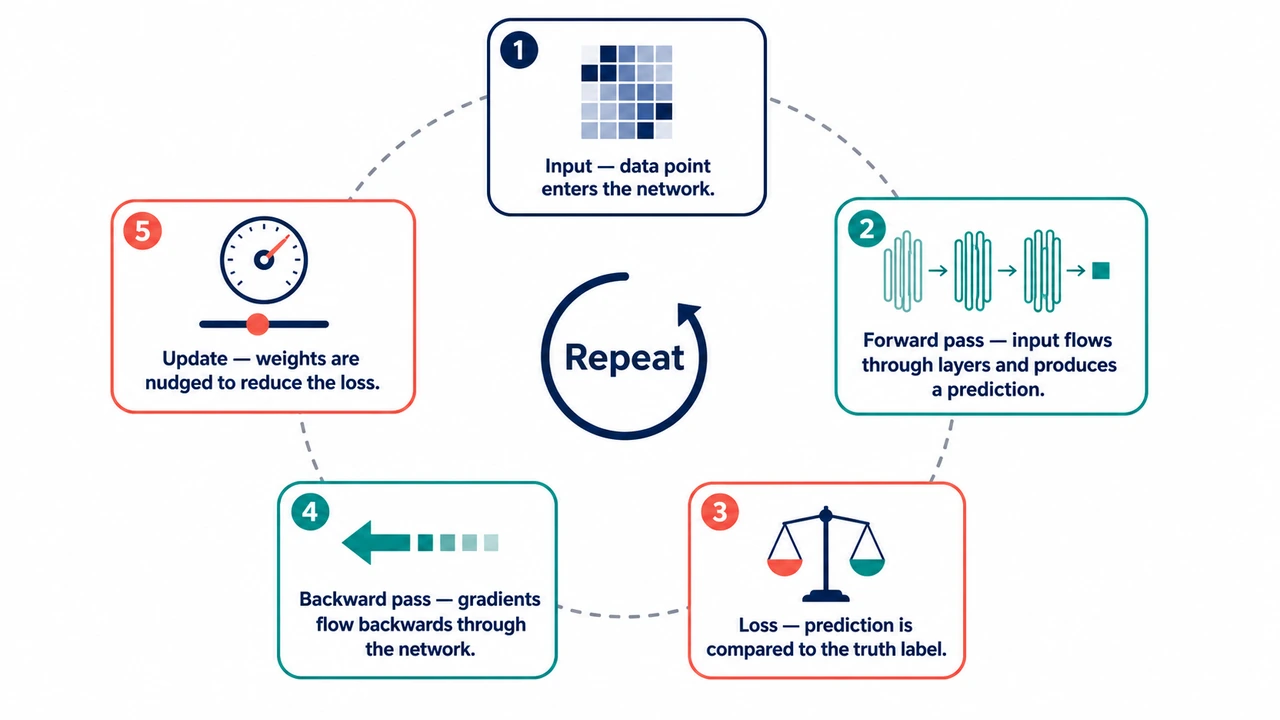
Process Cycle Infographic (Educational)

Process Cycle Infographic (Educational)

An educational infographic showing how a neural network learns, in five steps arranged around a circle. Steps (clockwise, starting from 12 o'clock): 1) Input — data point enters the network. Icon: small grid of pixels. 2) Forward pass — input flows through layers and produces a prediction. Icon: stacked rectangles with arrows. 3) Loss — prediction is compared to the truth label. Icon: balance scale. 4) Backward pass — gradients flow backwards through the network. Icon: backward arrow. 5) Update — weights are nudged to reduce the loss. Icon: small dial / slider. Center of the circle: a small "Repeat" label with a circular arrow. Style: - Friendly but professional palette: navy, teal, coral on white. - Each step is a rounded rectangle on the circle's perimeter, with the icon on top and a one-line caption (max 6 words) below. - Numbered badges (1–5) in the top-left of each step. - Light dashed circle connecting the steps to suggest the cycle. - Sans-serif, optimized for textbook-page readability.

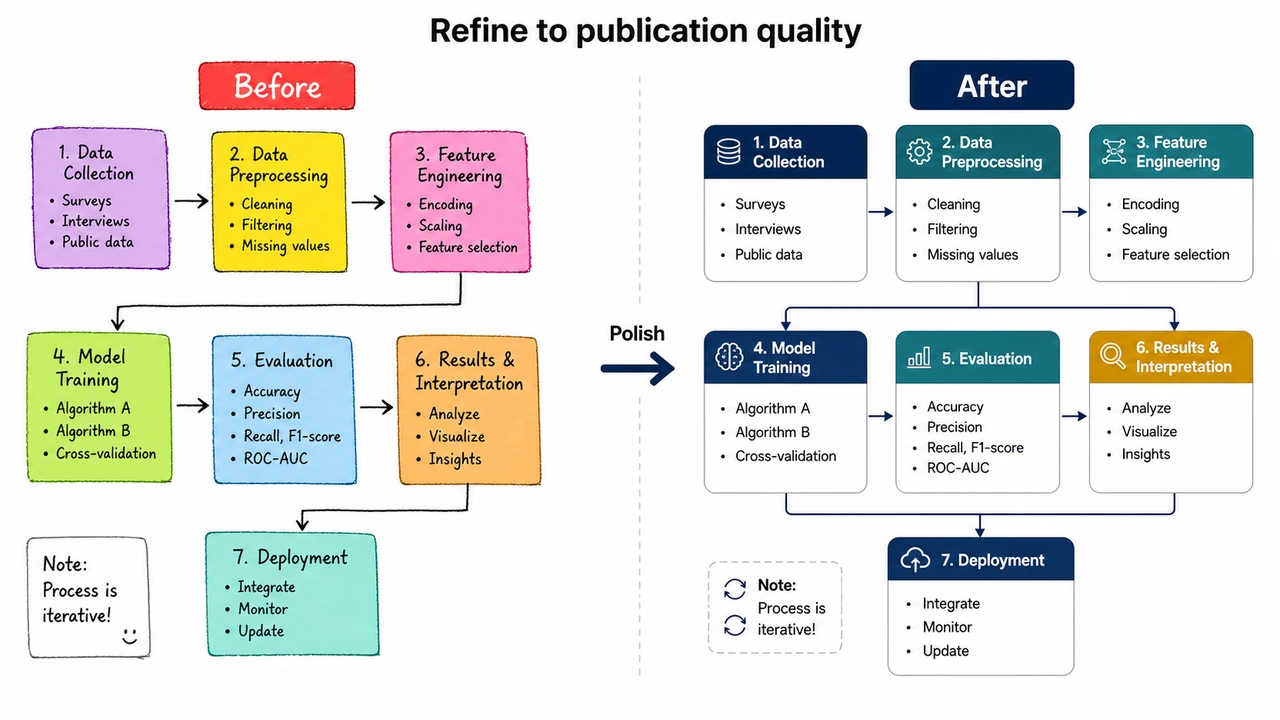
Static imagePNG
Static paper figure before editable reconstruction
Editable reconstruction
Reconstructed editable paper figure

Edit anything

rewrite text

What is Paper Banana AI?

Paper Banana AI is an AI academic illustration generator that turns method text, prompt templates, sketches, and reference images into structured academic diagrams. Paper Banana is built for researchers who need methodology figures, model architectures, statistical visuals, and publication-oriented illustrations without starting from a blank slide.

Structure-first generation

Paper Banana prioritizes modules, labels, arrows, layout hierarchy, and figure readability before visual decoration, so each Paper Banana draft starts with a usable research structure.

Reference-guided academic style

Use Paper Banana prompt examples or reference images to guide the figure type, visual style, and terminology toward familiar research-paper conventions. Paper Banana keeps those choices close to academic norms.

Editable, reviewable figures

Paper Banana AI figures are meant to be checked and refined: update labels, fix relationships, adjust layout, and export each Paper Banana figure for papers, posters, grants, or slides.

What can Paper Banana AI create?

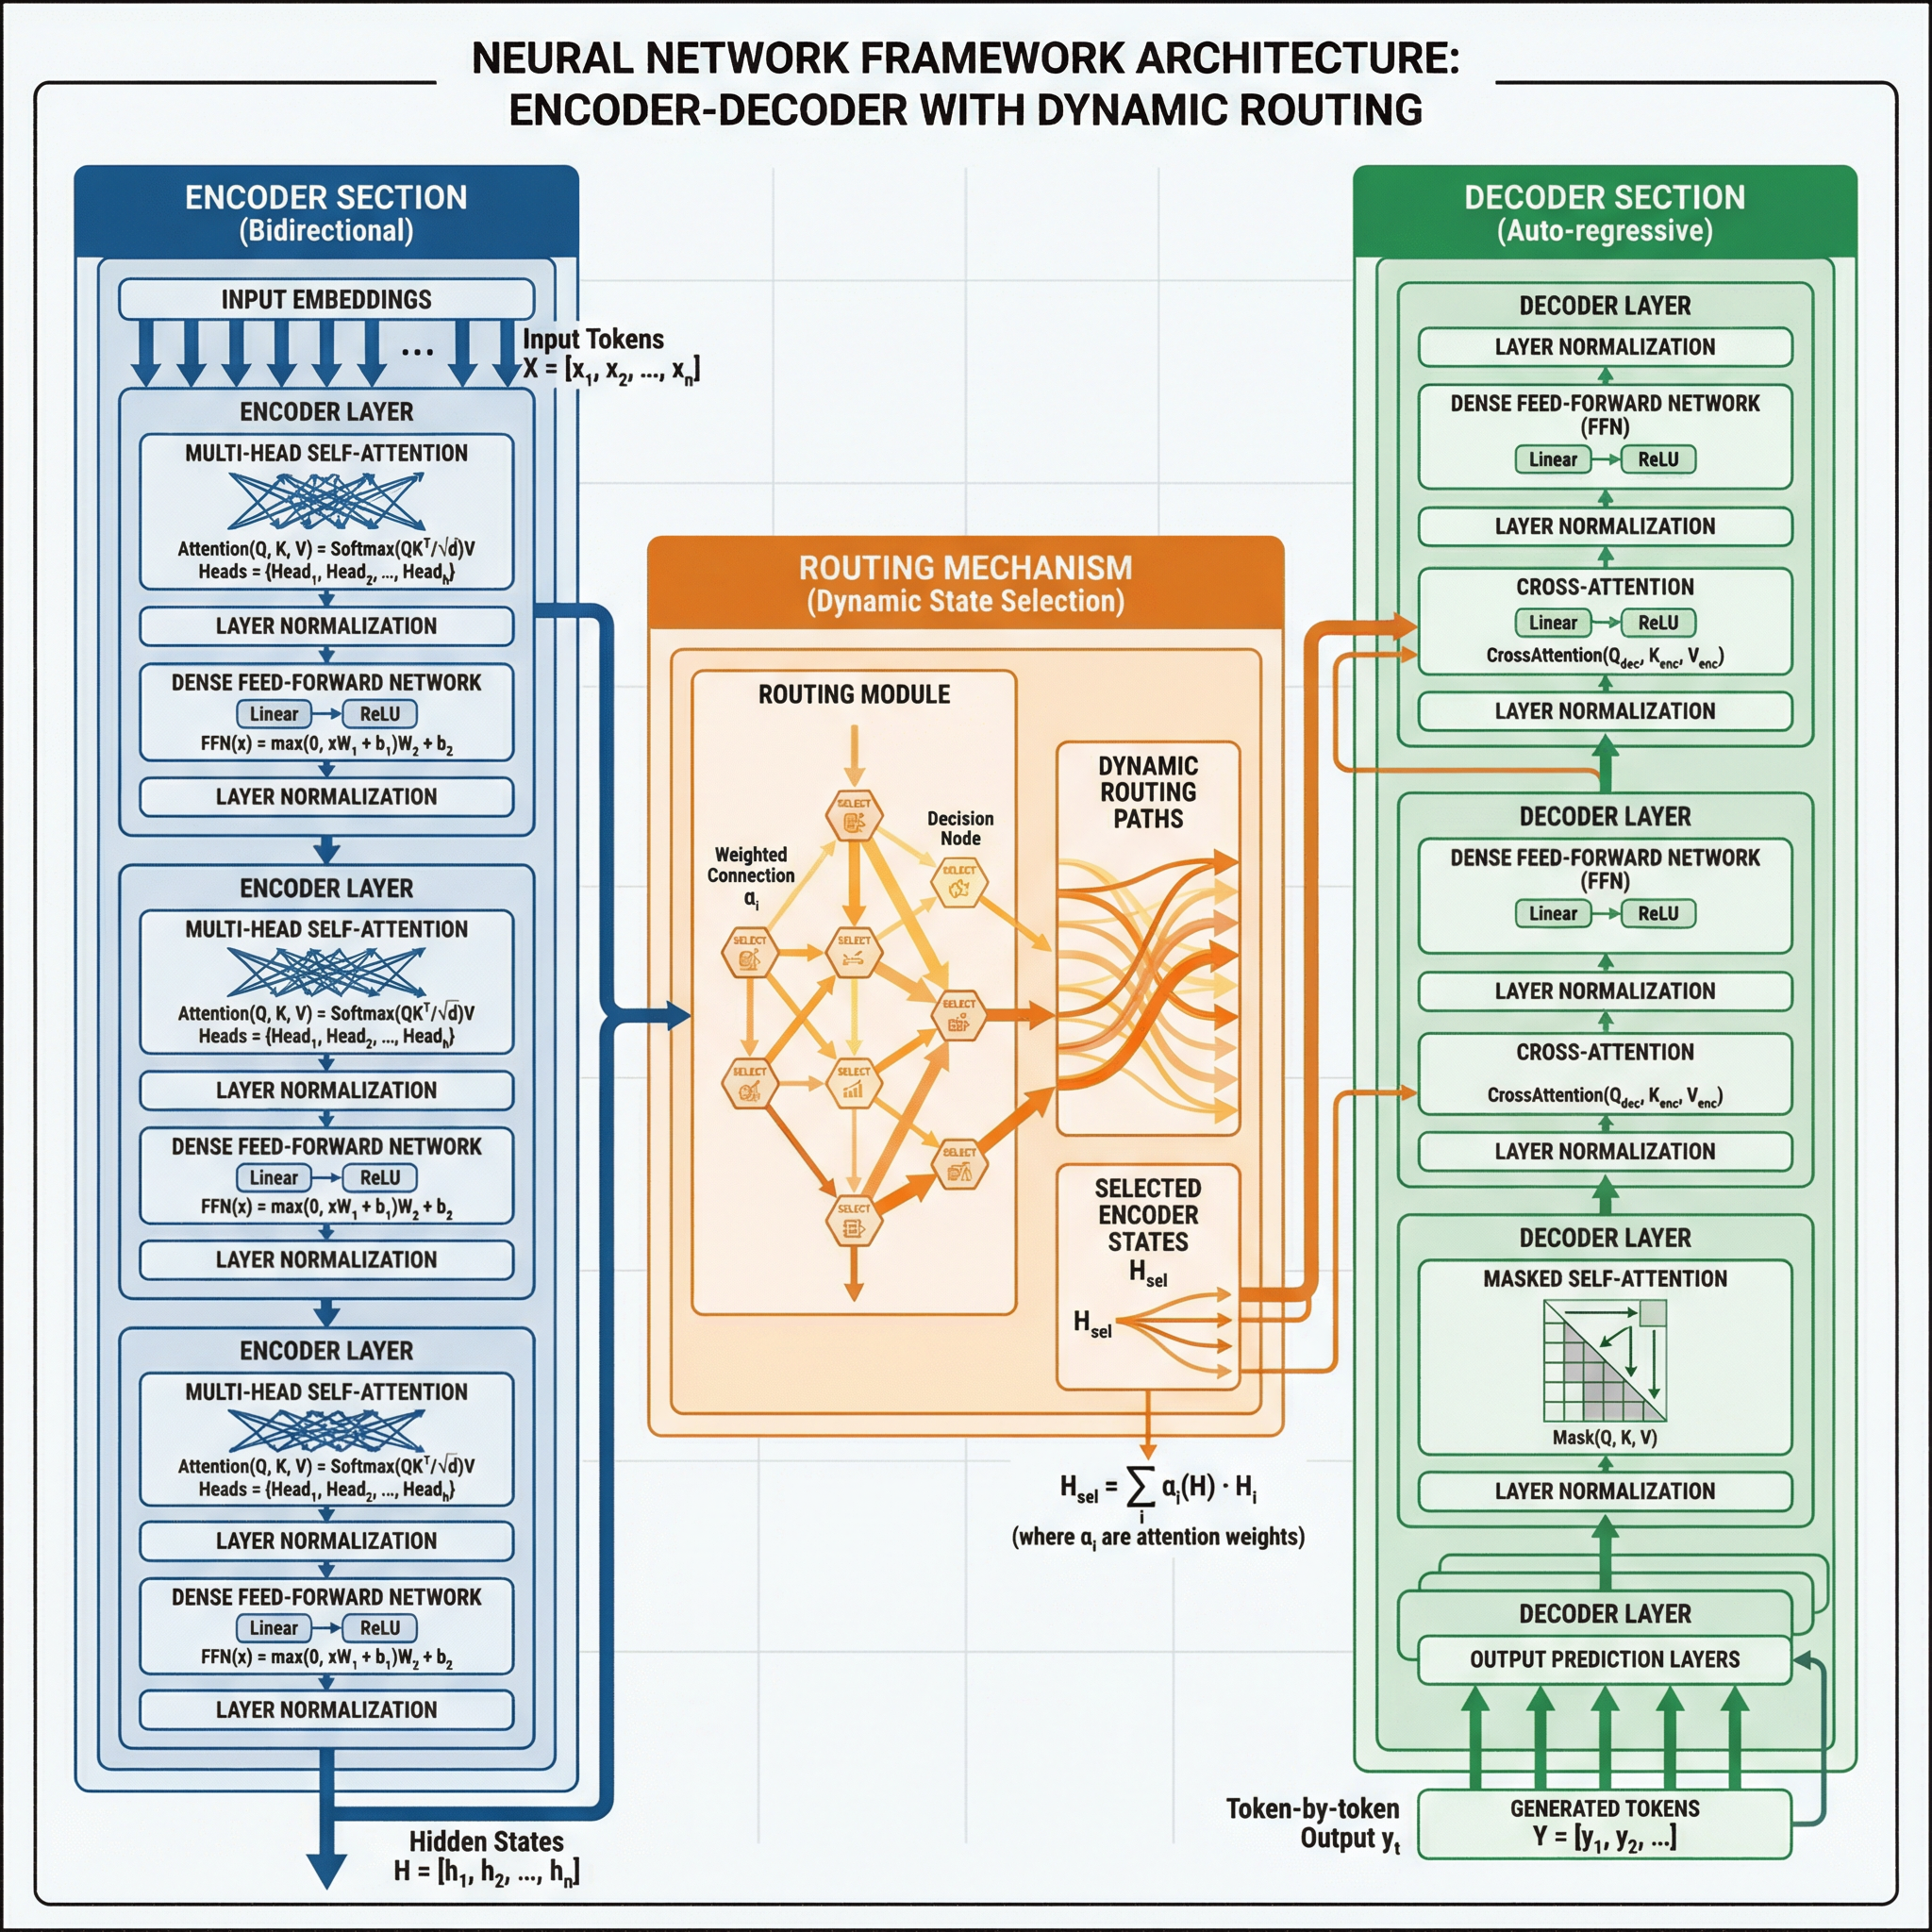
Paper Banana can turn method text, prompt templates, blank-canvas ideas, sketches, or old diagrams into methodology figures, model architectures, editable reconstructions, and research paper figure generator outputs you can keep refining. Use Paper Banana as a methodology diagram generator when you need a clear first draft fast.

Methodology figures

Methodology figures

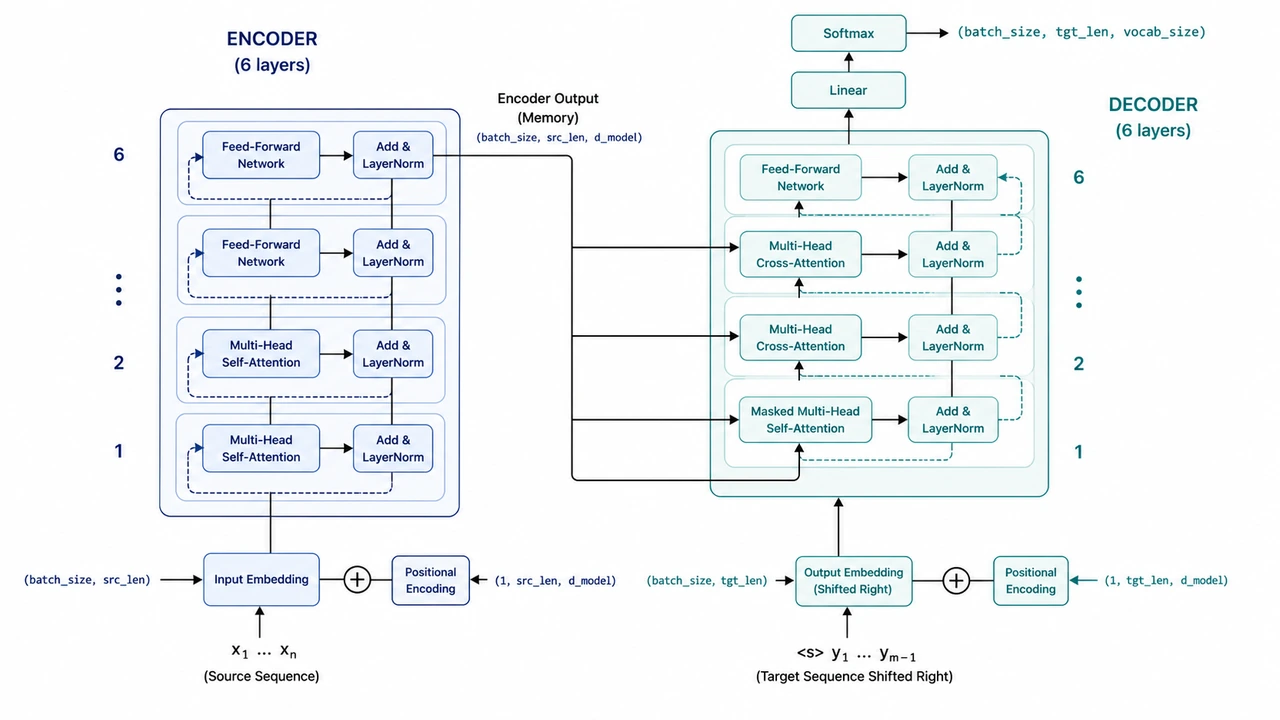
Start from a blank canvas, a method paragraph, or a prompt template. Paper Banana gives you clear blocks, arrows, layout, and short labels you can critique before export, so each Paper Banana draft begins with usable structure.

Static imagePNG
Static paper figure before editable reconstruction
Editable reconstruction
Reconstructed editable paper figure

Edit anything

rewrite text

Editable figure reconstructions

Use Paper Banana to fix labels, arrows, colors, and layout after generation instead of accepting one frozen AI image that cannot survive revision. Paper Banana keeps the cleanup step editable.

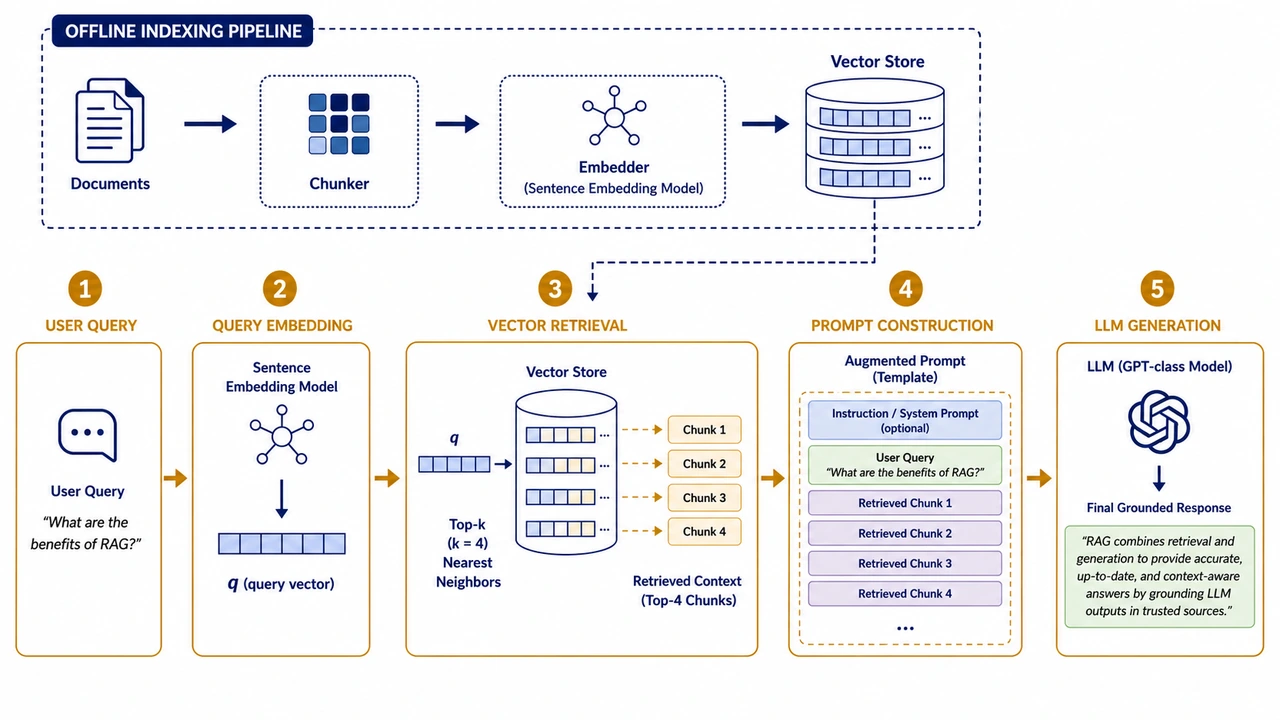
Prompt-based academic illustrations

Prompt-based academic illustrations

Start from RAG, Transformer, agent workflow, training pipeline, poster, and Paper Banana prompts so the result follows a recognizable academic illustration type when you generate in Paper Banana.

Manual drafts to publishable figures

Manual drafts to publishable figures

Use hand-drawn drafts, screenshots, or old diagrams as references. Paper Banana rebuilds them into clean, paper-ready academic illustrations while keeping labels, relationships, formulas, and data meaning reviewable before submission.

How it works

How to Use Paper Banana AI

Let Paper Banana build the structure first, then use your expertise to review the science, refine labels, and choose the right export format.

1

Describe the figure you need

Start with a method section, prompt, sketch, or reference image. Add the modules, labels, and relationships your Paper Banana figure needs to show.

2

Generate a structured draft

Choose a style and export format. Paper Banana creates a clean academic illustration draft you can inspect before spending more credits.

3

Review and export

Check the science, simplify crowded labels, adjust arrows, and export PNG, draw.io, or editable PPT for manuscripts, posters, grants, slides, or teaching.

Pricing

Paper Banana AI Price

1K research figures use 5–8 credits, while 2K/4K figures cost more by resolution and model. Use credits for a paper sprint, or subscribe when your lab needs a steady workflow.

View full Paper Banana pricing
50% OFF

Basic

$12.49/month
$299.88$149.9/yearSave 50%

Research figures cost about $0.1–$0.17 each

For one paper, poster, or lab presentation

Secure payment · Cancel anytime


  • 600 credits per month (7,200 credits/year)
  • About 900-1,440 research figures / year
  • All image models: GPT Image 2 and Nano Banana 2 / Pro
  • Create academic figures from paper context or templates
  • Upload reference figures to keep a consistent visual style
  • Watermark-free HD PNG and editable PPT / draw.io exports
  • Use outputs in personal and commercial projects

    Credit validity: your annual subscription term

    50% OFF

    Enterprise

    $49.95/month
    $1,198.8$599.4/yearSave 50%

    Research figures cost about $0.07–$0.11 each

    For labs, research groups, and multiple active projects

    Secure payment · Cancel anytime


    • 3,600 credits per month (43,200 credits/year)
    • About 5,400-8,640 research figures / year
    • All image models: GPT Image 2 and Nano Banana 2 / Pro
    • High-volume figures for papers, grants, talks, and teaching
    • Continuous iteration from paper context and reference figures
    • Watermark-free HD PNG and editable PPT / draw.io exports
    • Use outputs in personal and commercial projects

      Credit validity: your annual subscription term

      One-time purchaseNot ready to subscribe? Start with credits
      $6.99
      100 credits · One-time purchase · No subscription

      Create more figures before choosing a plan. Available once per account.

      Pay safely and securely with Stripe
      Supported payment method logos

      Paper Banana AI FAQ

      Who is Paper Banana for?+

      Paper Banana is built for AI/ML, CS, engineering, and research teams that need methodology diagrams, model architecture figures, training pipelines, posters, grants, slides, or teaching visuals without starting from a blank canvas. Paper Banana is especially useful when the science is clear but the first visual draft is still missing.

      What does Paper Banana AI do?+

      Paper Banana AI turns method text, model descriptions, blank-canvas ideas, prompt templates, and reference images into controllable academic illustrations that you can inspect, revise, and export. Use Paper Banana when you need a structured draft in Paper Banana before final design cleanup.

      Can I use Paper Banana figures in a paper submission?+

      Treat every Paper Banana output as an AI-assisted academic illustration. Before submission, review labels, arrows, formulas, component names, data meaning, and venue requirements, then make final edits in your preferred design tool.

      Why use Paper Banana instead of a generic AI image generator?+

      Generic image tools optimize for visual appeal. Paper Banana focuses on paper-specific academic illustration patterns: method sections, model blocks, pipeline arrows, short labels, and Paper Banana cleanup workflows you can keep editing.

      How many credits does one Paper Banana generation cost?+

      1K images usually use 5–8 credits, 2K uses 8–18 credits, and 4K uses 16–40 credits. Editable PPT and draw.io exports add 8 credits each, and the generator shows the exact cost before you submit.

      What happens if a Paper Banana generation fails?+

      If provider-side generation fails, Paper Banana surfaces the failure state where possible. For billing issues, duplicate charges, or technical failures, contact support with your account email and order details so the case can be reviewed.

      Are my Paper Banana prompts, uploads, and research details private?+

      Use Paper Banana according to the current privacy policy and avoid uploading sensitive material you cannot share with the service. If you need team-level privacy, invoices, or specific data handling terms, contact support before choosing a plan.

      Should I buy Paper Banana credits or a monthly plan?+

      Use one-time Paper Banana credit packs for a paper sprint, poster session, grant, or slide deck. Choose a monthly Paper Banana plan when you expect weekly figure work, repeated exports, or a lab workflow with many figures.

      Start your first Paper Banana academic illustration

      Choose a prompt or describe the method you need to explain. Paper Banana generates a checkable academic illustration first, then lets you decide whether to export PNG, draw.io, or editable PPT.

      Generate with Paper Banana